Cron Job Monitoring
A nightly database backup that exits cleanly but uploads nothing is the worst kind of failure. Cron runs the script, the script returns 0, and cron is satisfied. It has no idea whether the dump actually reached S3, or whether the disk filled up and the upload failed without a word. You find out weeks later, on the one morning you reach for that backup and it isn't there.
That gap, between the schedule fired and the job did its work, is what cron job monitoring closes. WatchCron watches the clock on your behalf and tells you when a scheduled job didn't run, failed while running, or took far longer than it should have.
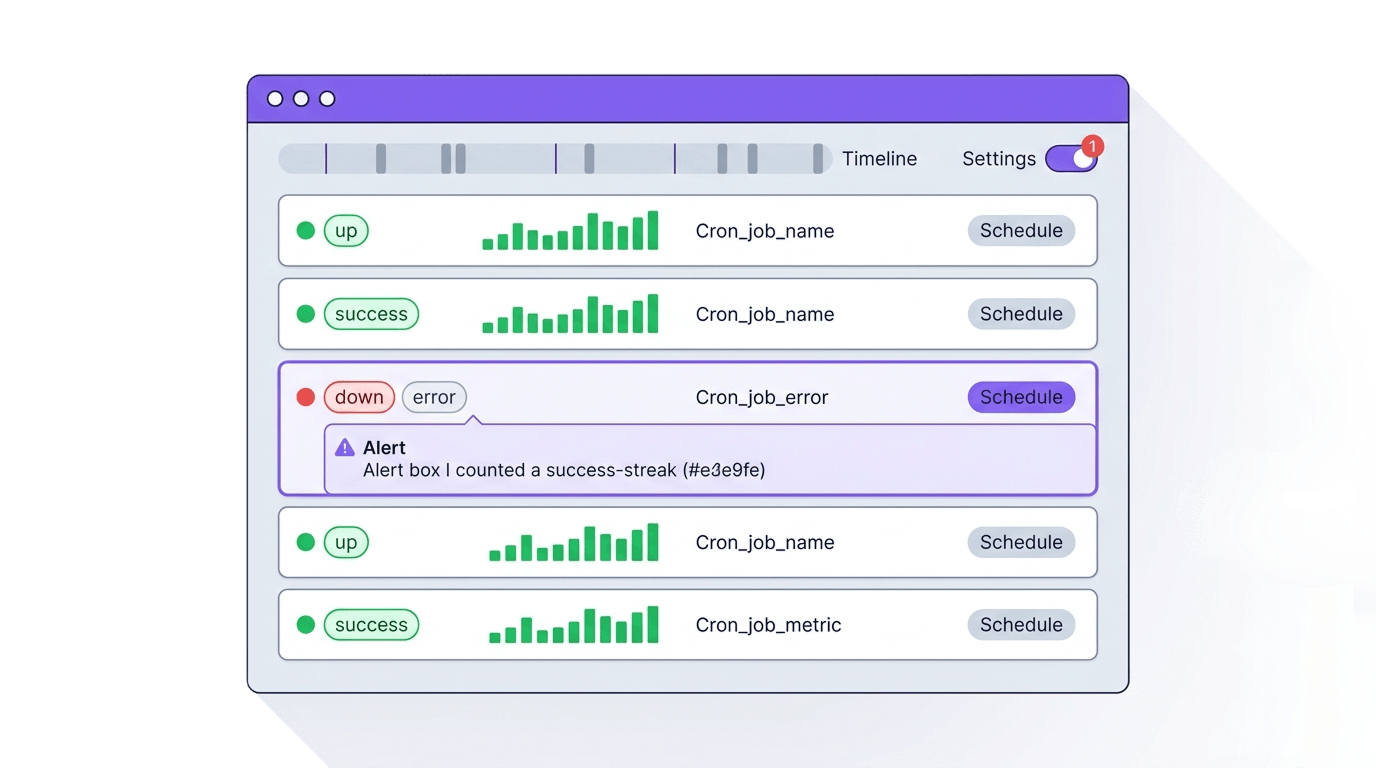
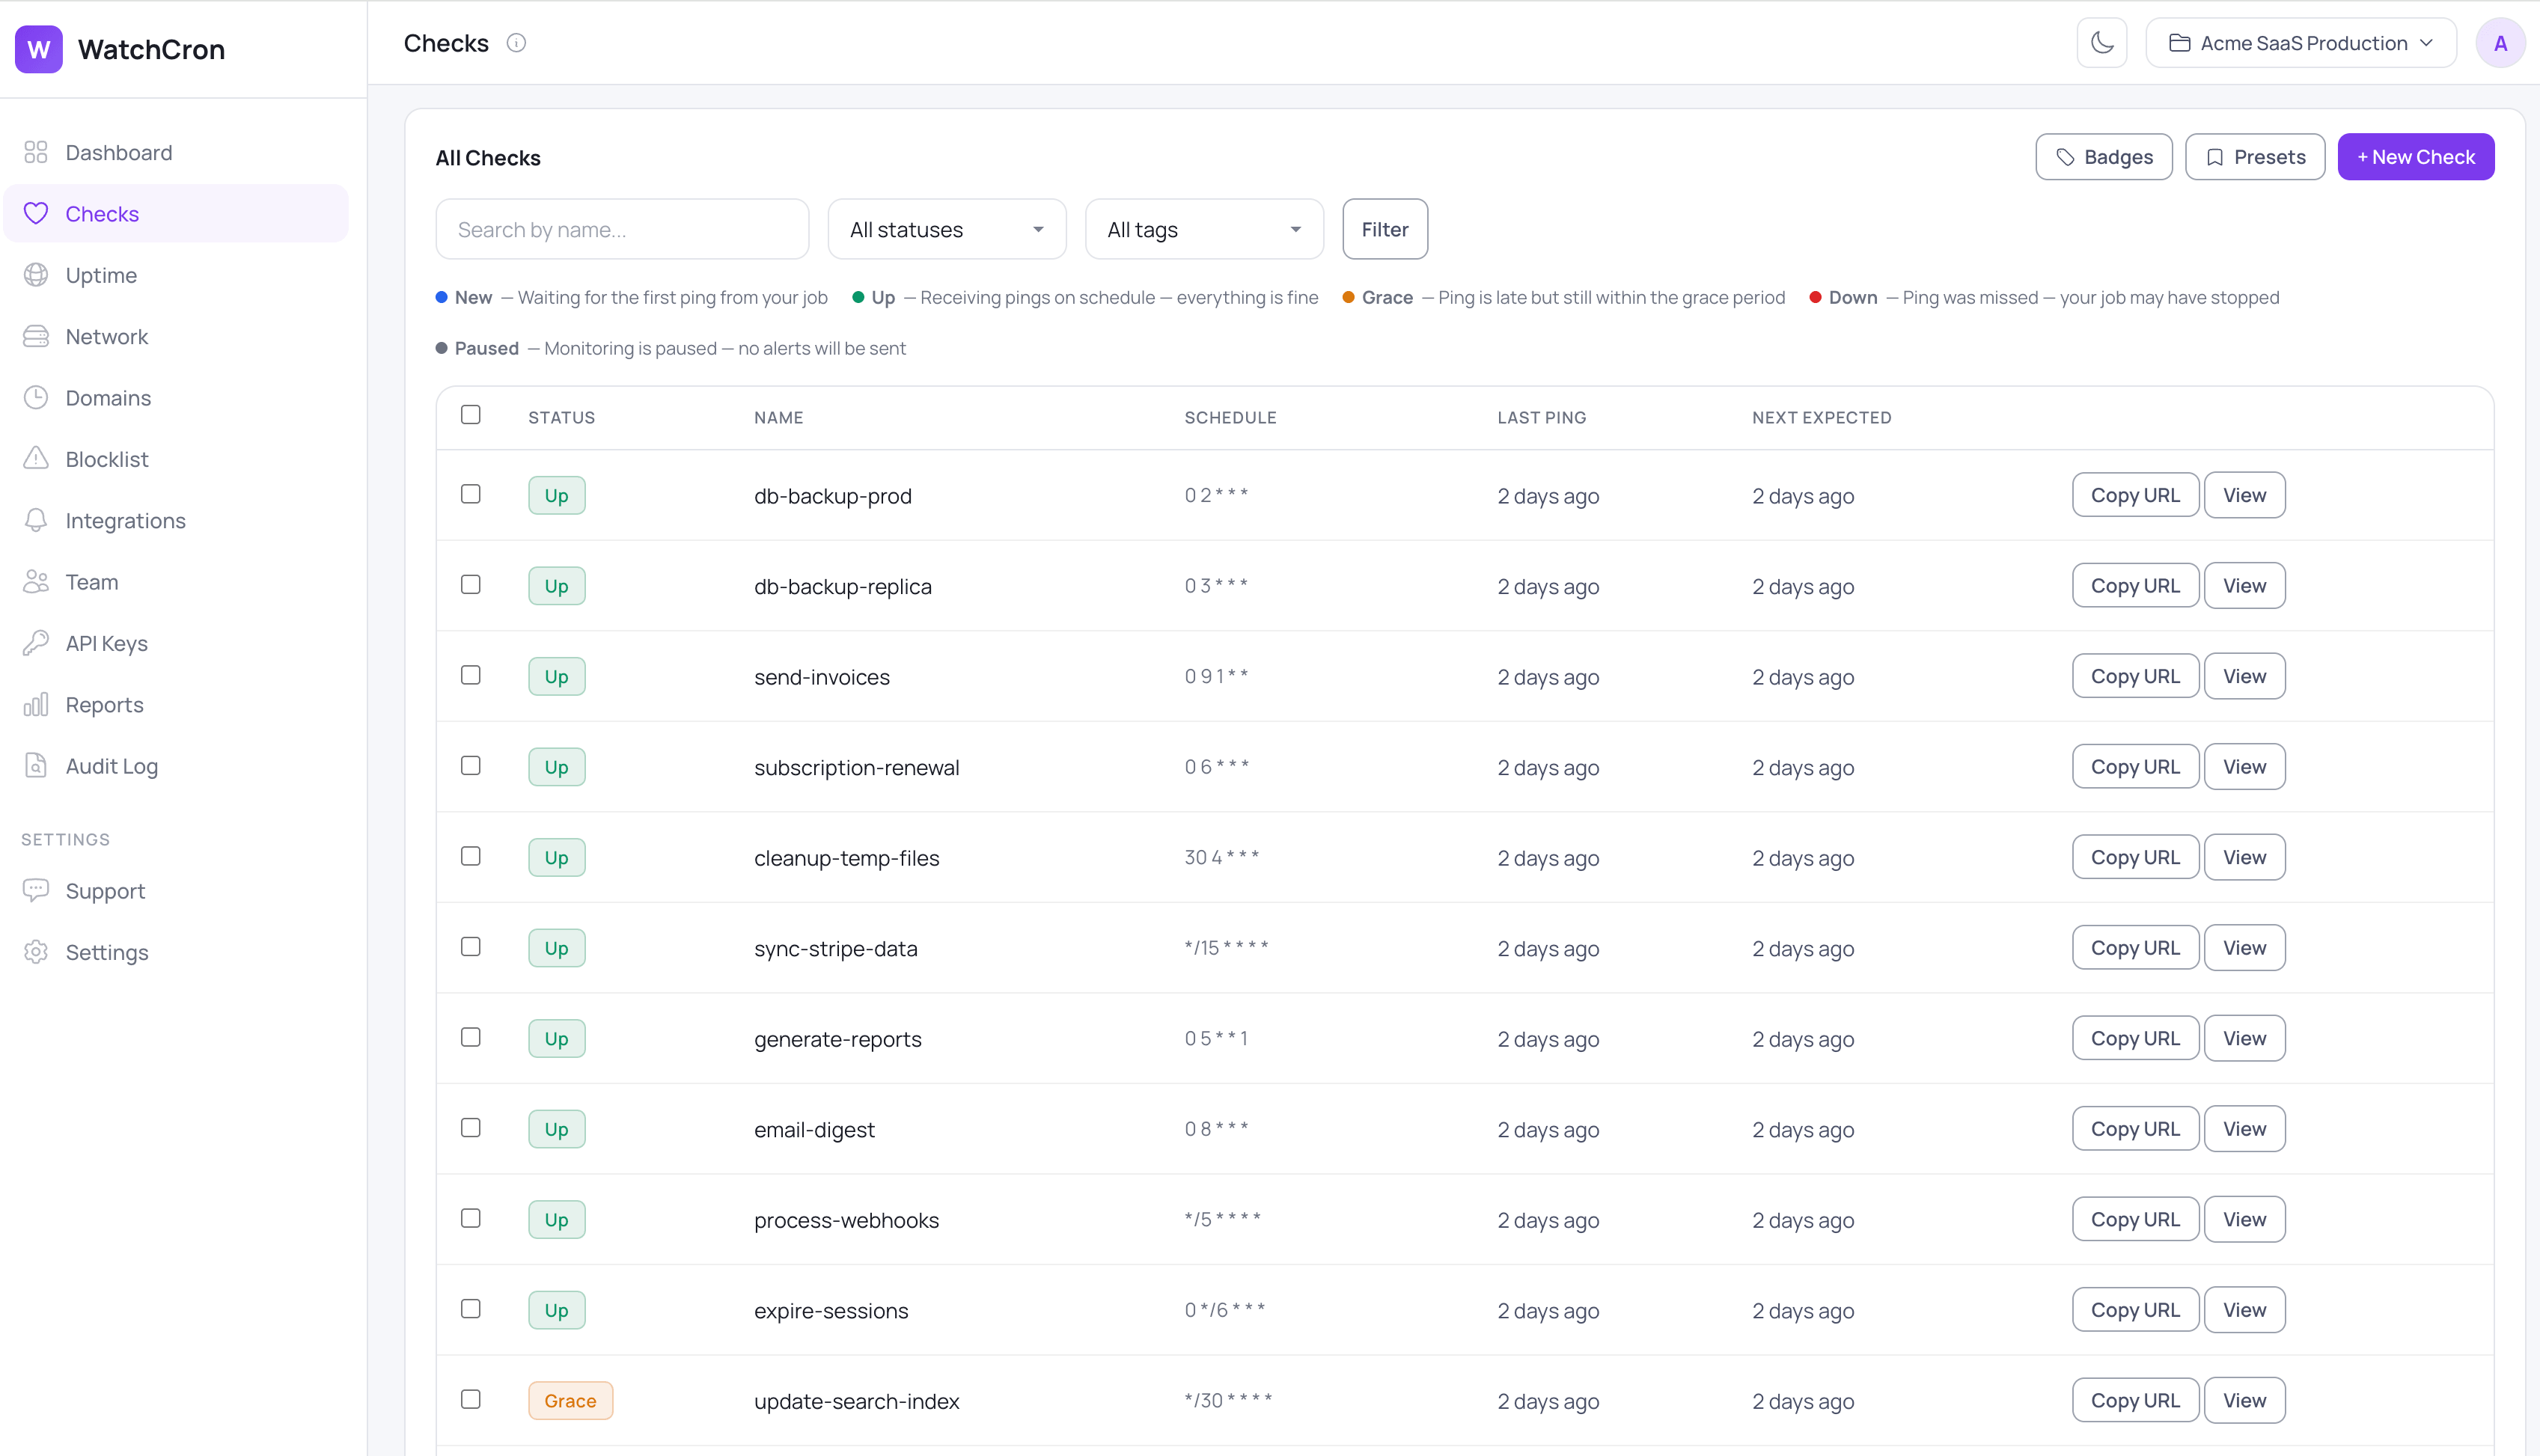
Every job you hand to WatchCron lives on one Checks screen, each row showing its schedule, when it last reported in, and whether it's currently healthy, running late, or missed. A green row means the heartbeat arrived on time; an amber or red one is the early warning you'd otherwise be waiting on your logs to give you, often long after the fact.
How heartbeat monitoring works, in three steps
The idea behind it is a heartbeat: your job checks in with us every time it runs, and we watch for that check-in to arrive on time.
First, create a monitor and grab its ping URL. Every monitor has a unique URL you can reference either by UUID or by a readable slug:
https://watchcron.com/ping/550e8400-e29b-41d4-a716-446655440000   # UUID
https://watchcron.com/ping/my-backup-job                          # slug
Second, add a ping to the end of your job. For most cron jobs that's a single extra line in your crontab:
*/5 * * * * /opt/app/backup.sh && curl -fsS --retry 3 https://watchcron.com/ping/my-backup-jobThe && is doing real work here: the ping only fires if backup.sh exits successfully, so a failed backup never reports a false "all good".
Third, we watch the schedule. We know when the next check-in is due, and if it doesn't show up in time the monitor moves through a short grace window and then to Down, and we alert you. The endpoints accept any HTTP method, so a GET or a POST both work, and a POST can carry up to 100 KB of body if you want to attach output.
What WatchCron catches that a plain ping doesn't
A simple "did the ping arrive" check only notices one kind of trouble. A scheduled job can fail in three different ways, and each one needs a different response, so we track them as separate events.
The first is a job that never ran. We check every minute whether a monitor's next heartbeat is overdue. This is the case that bites hardest, because nothing errors and nothing crashes. The classic version: a backup entry gets dropped from the crontab during a deploy, and the absence of the heartbeat is the only thing that surfaces it. This is the same principle behind a dead man's switch.
The second is a job that ran but failed. Report the failure path explicitly and the monitor flips to Down right away, instead of waiting for the next missed window:
/opt/app/backup.sh && curl -fsS https://watchcron.com/ping/my-backup-job \
  || curl -fsS https://watchcron.com/ping/my-backup-job/fail
The third is a job that ran too long. Send a start ping before the work and a success ping after it, and we measure how long the run actually took:
curl -fsS https://watchcron.com/ping/my-backup-job/start
/opt/app/backup.sh
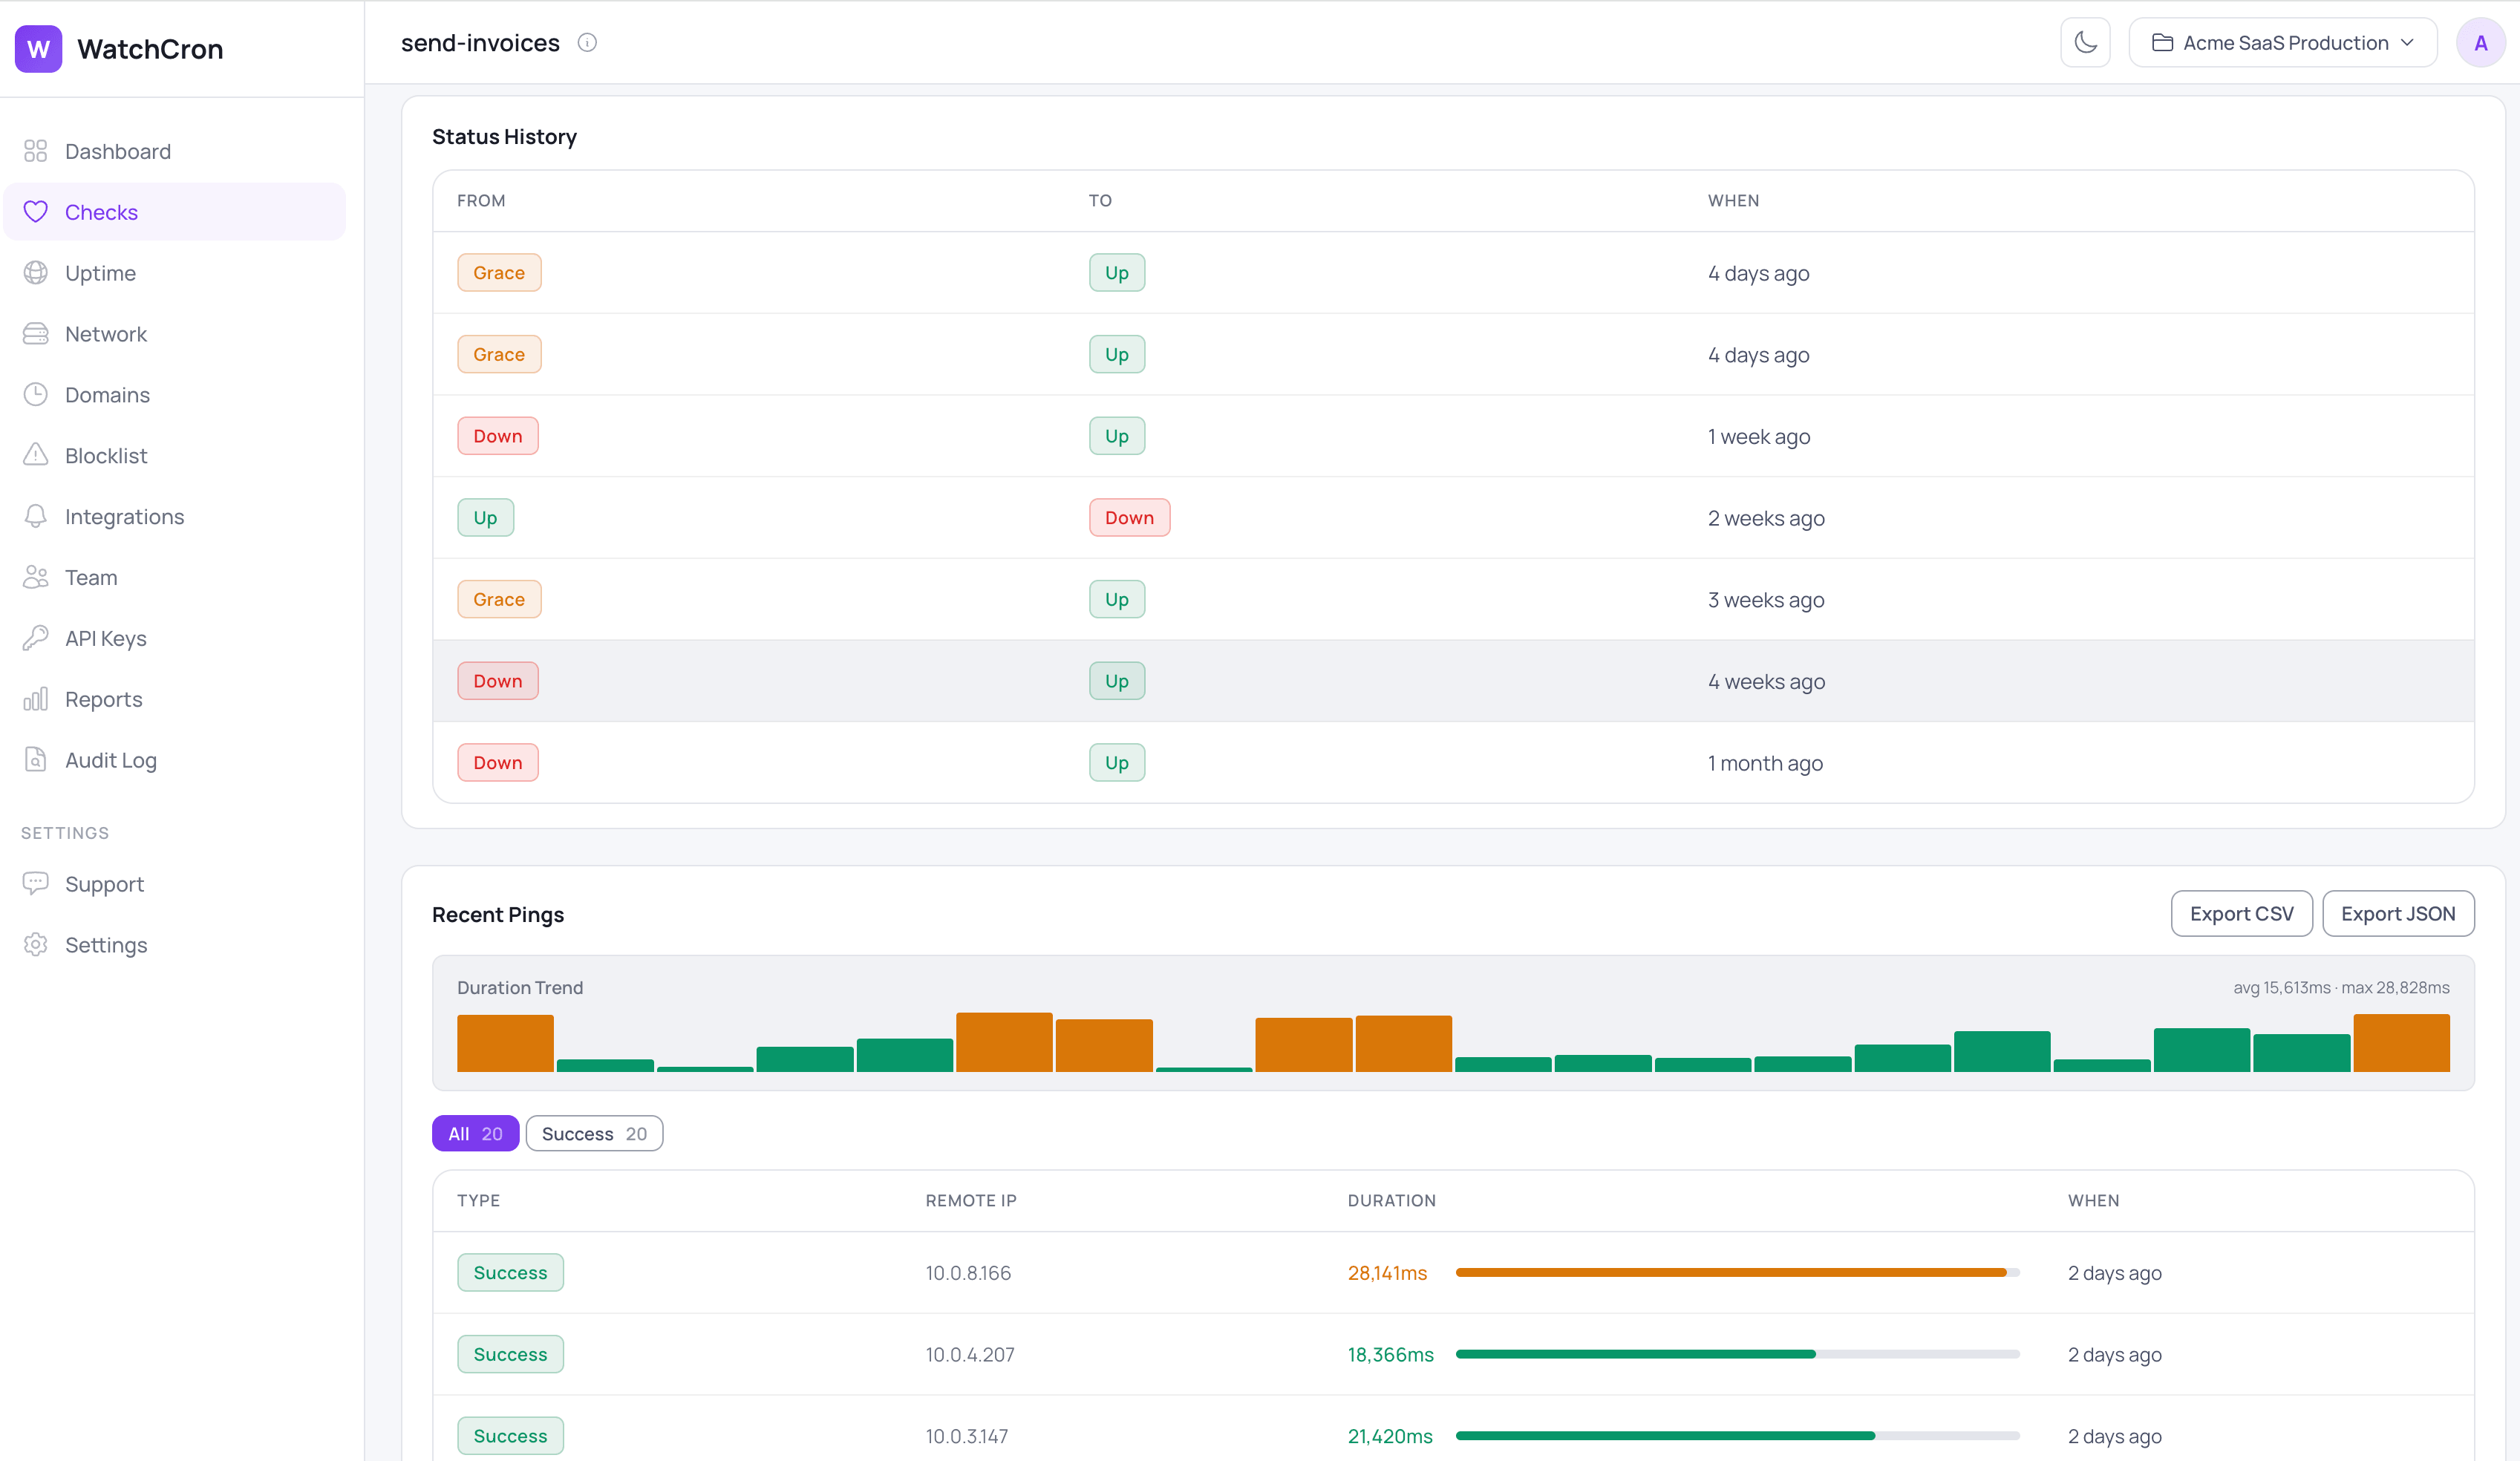
curl -fsS https://watchcron.com/ping/my-backup-jobIf the duration crosses the threshold you set, you hear about it while the job is still merely slow, which is usually well before a slow job becomes a missed one. Across all three cases a monitor moves through clear states, from New to Up, into Grace when a check-in is late, and to Down when it's genuinely missed, plus Paused when you mute it on purpose. Each monitor keeps that history, alongside the duration of recent runs, so a job that's been creeping slower over weeks is visible rather than buried.
What a monitor watches, and what you can tune
Every monitor exposes the same set of controls, so you can make it as forgiving or as strict as the job deserves:
Capability | What it does | Default / control |
|---|---|---|
Missed-run detection | Alerts when a scheduled check-in never arrives | Checked every minute |
Failure alerts | Flips the monitor to Down the moment a job pings | Immediate |
Duration alerts | Flags a run that exceeds its time budget |
|
Grace period | Absorbs normal lateness before anything alerts | 5 minutes, per job |
Consecutive-miss threshold | Waits for several misses before paging |
|
Schedule modes | Simple interval (every N minutes/hours/days) or full cron expression (with a "Next 5 runs" preview so you can verify timing before saving) — with per-check timezone | Both modes, per check |
Maintenance windows | Suppresses alerts during defined time windows — deploys, migrations, planned downtime | Day/time ranges, per check |
Repeat notifications | Re-alerts if a check stays down beyond a configurable interval | Off by default, per check |
Ten alert channels | Routes the alert to where your team already works | Slack, email, SMS, PagerDuty, and more |
Readable identifiers | Lets you reference a monitor by UUID or by slug | Either works |
What teams actually monitor with it
The same heartbeat covers most of the jobs that quietly matter:
Nightly database backups, where a clean exit code can still mean nothing reached storage.
ETL and data-pipeline jobs that feed the dashboards your team checks every morning.
If invoices or scheduled reports have to go out on a fixed day, a missed run is a billing problem, not just an ops one.
Certbot and other certificate renewals, so a failed renewal doesn't expire on you weeks later.
Queue workers and cache-clearing tasks that keep a server from slowly filling up.
Grace periods keep false alarms out
Cron clocks drift, networks hiccup, and a job that usually finishes at 02:00 might land at 02:04 on a busy night. If every late check-in paged someone, your team would learn to ignore the alerts within a week. So each monitor has a grace period, five minutes by default, that a job is allowed to run late before we count the check-in as missed. You can set it per job, and for tasks that fail now and then for reasons outside your control, you can also require a few consecutive misses before an alert goes out.
Two scheduling modes: interval and cron expression
Most monitoring tools work on intervals: 'ping me every 60 minutes.' That works fine for jobs that run frequently, but a job scheduled at 0 3 * * 1 — 3 AM every Monday — doesn't fit the interval model cleanly. You'd have to configure 10,080 minutes and still wouldn't know whether the job ran at the right time or just at some point during the week.
WatchCron supports full cron expression scheduling alongside simple intervals. Enter an expression, pick a timezone, and the platform calculates exactly when the next run is due — the same way a cron daemon does it. When you're editing a check, the interface shows the next five scheduled times so you can confirm the expression is correct before saving. A job that runs every Monday at 3 AM in Europe/Berlin gets monitored in Europe/Berlin time, regardless of the server timezone.
Maintenance windows stop false alerts
Deploys, database migrations, and planned maintenance all produce the same symptom: cron jobs don't run. Without a way to tell your monitoring tool about planned downtime, every maintenance window generates a false alert. WatchCron lets you define recurring time windows per check — for example, no alerts between 02:00 and 04:00 on Sunday nights. Any missed check-in that falls inside the window is silently skipped. The moment the window closes, normal monitoring resumes.
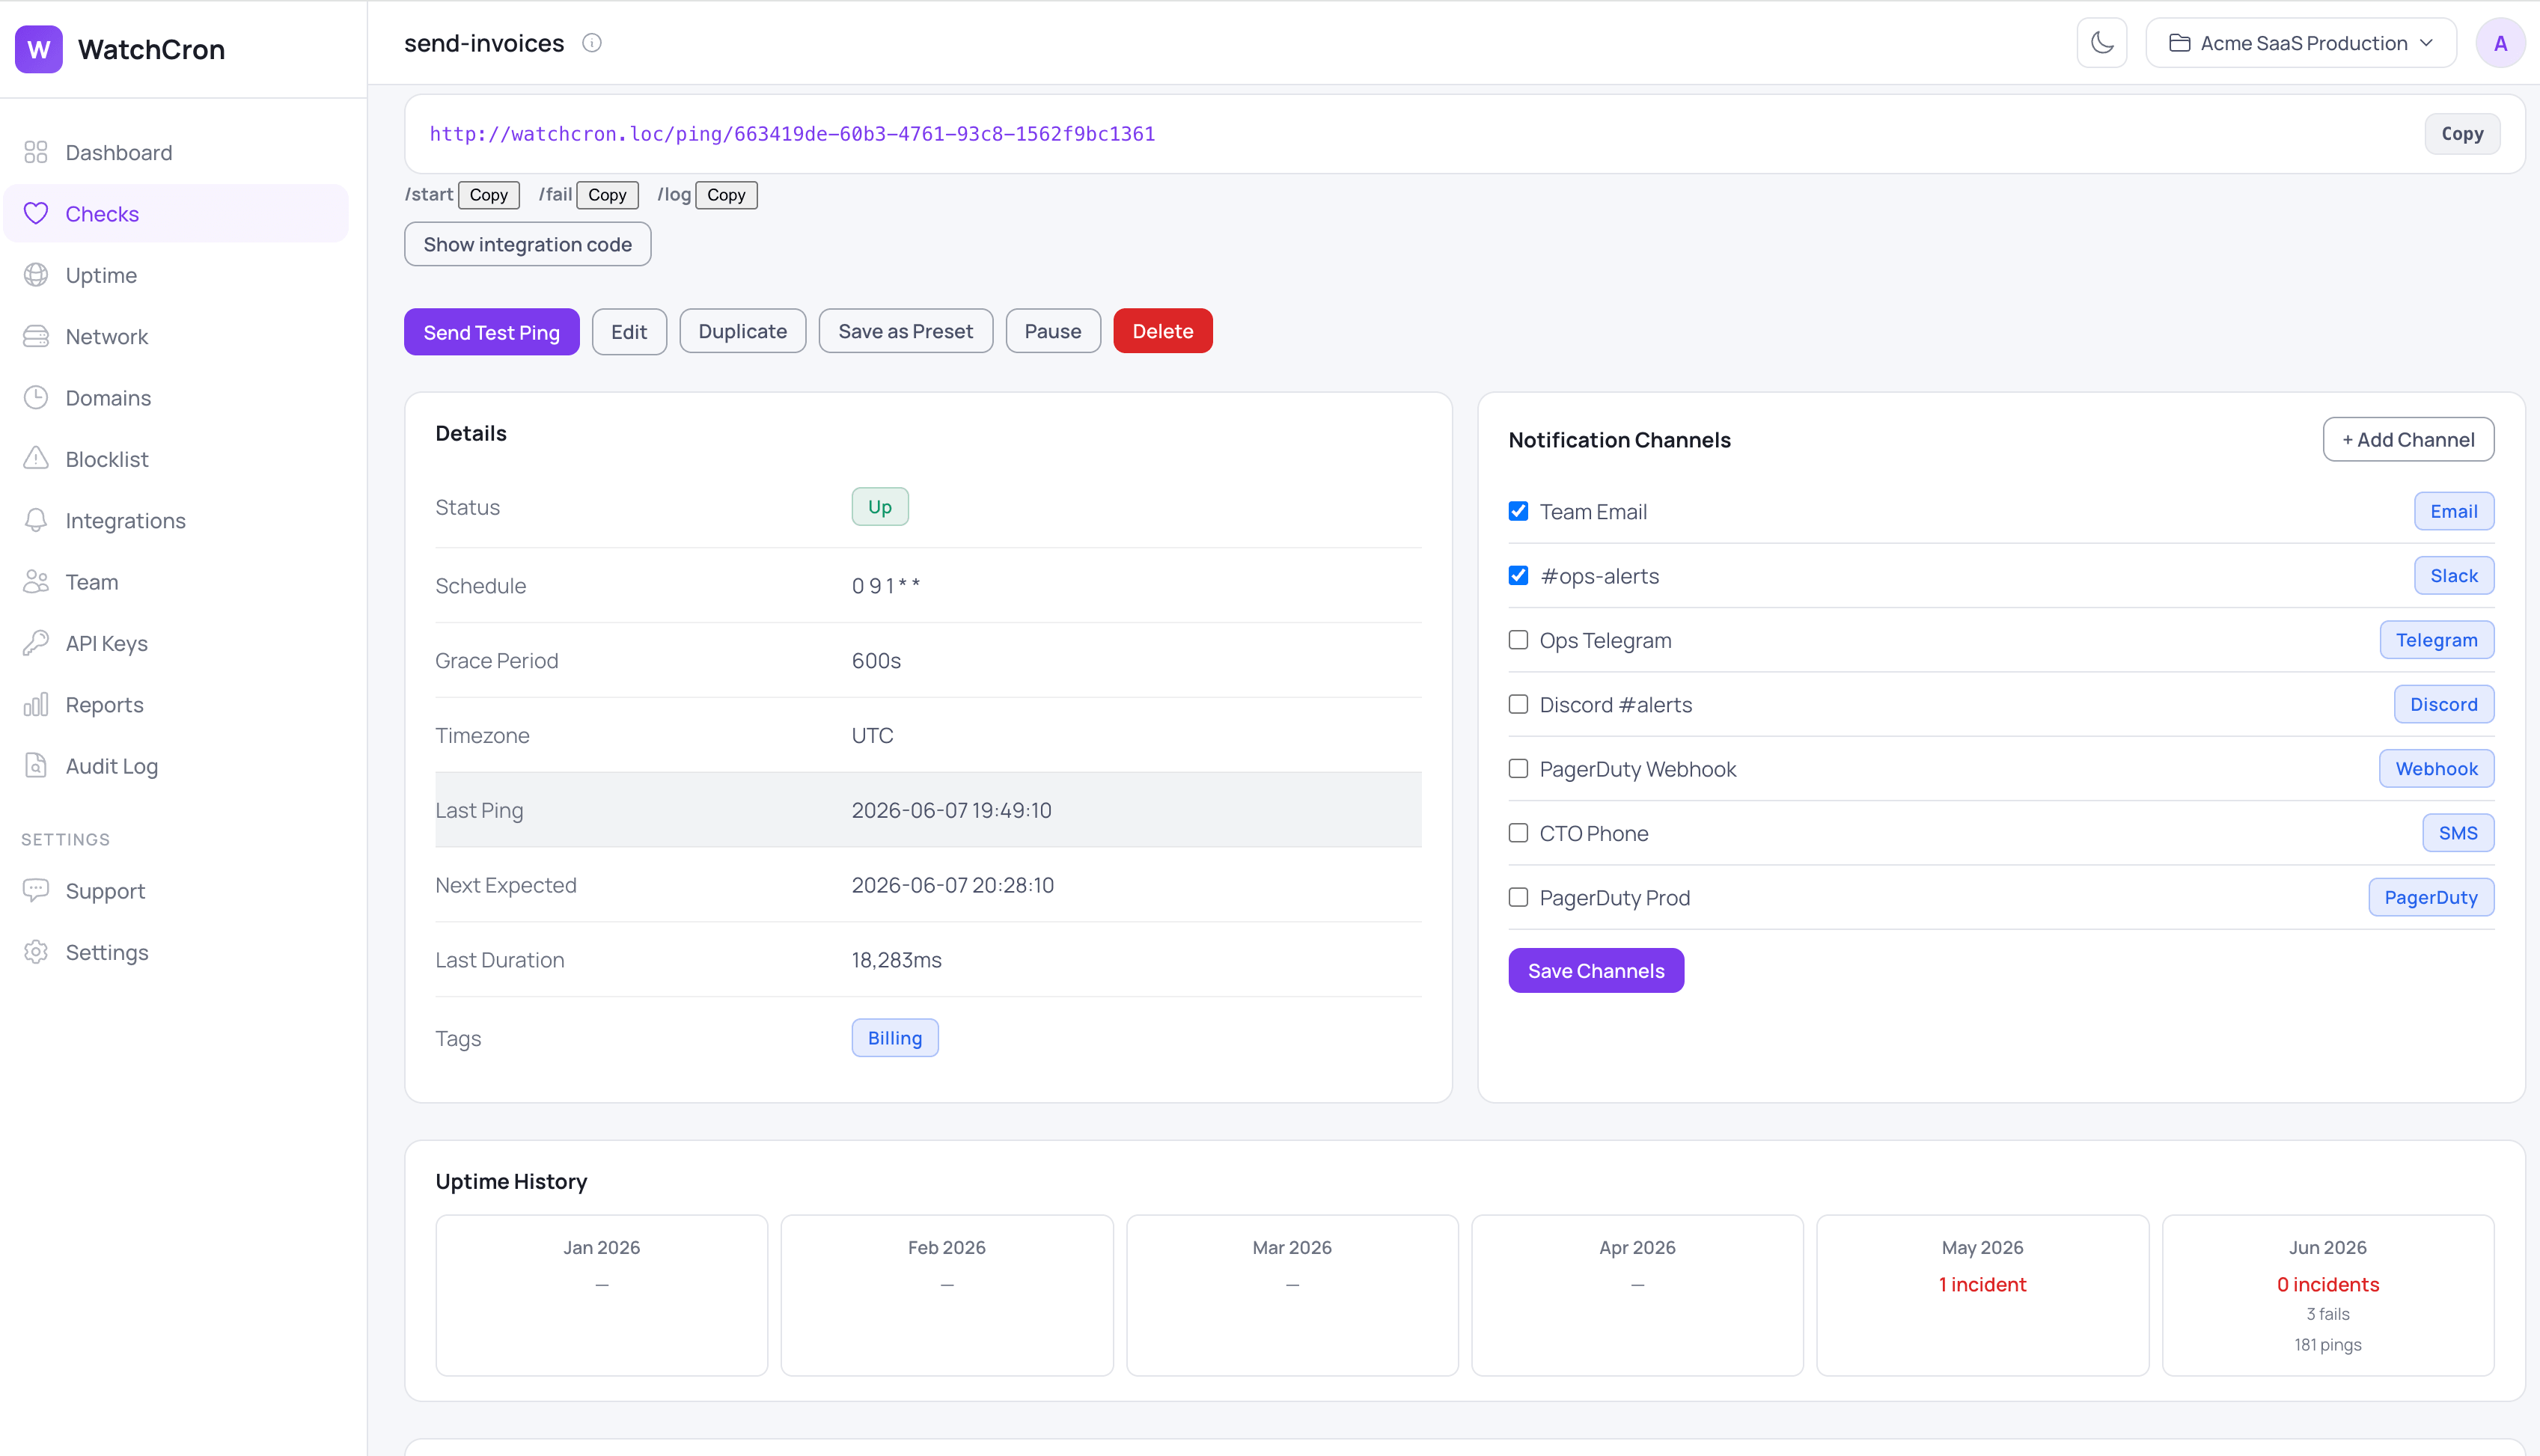
Alerts reach your team where they already are
We deliver alerts through ten channels. Email and webhooks work on every plan, including the free one. Slack, Telegram, Discord, and Microsoft Teams come in on the Starter plan, SMS arrives on Pro, and phone-call, PagerDuty, and OpsGenie alerts are on Business for the jobs you genuinely can't afford to miss. Every Down and Fail notification includes a one-click acknowledgement link. Clicking it suppresses repeat notifications for 24 hours — no login required, works from any device.
Works with anything that speaks HTTP
Because a monitor is just a URL, any language that can make an HTTP request can report to it. curl covers most cron jobs, but the same call translates directly into whatever your job is written in:
python
# Python
import requests
requests.get("https://watchcron.com/ping/my-backup-job")
js
// Node.js
await fetch("https://watchcron.com/ping/my-backup-job");
php
// PHP / Laravel
Http::get('https://watchcron.com/ping/my-backup-job');
Laravel's scheduler is a common case, and there's a dedicated walkthrough for monitoring scheduled commands. On servers where you'd rather not hand-edit every crontab line, a CLI agent can register and ping your jobs for you. And if you're still writing the schedule itself, the cron expression builder turns plain English into a valid expression, while the cron expression cheat sheet covers the syntax you'll reach for most.
What cron job monitoring won't do
Heartbeat monitoring tells you that a job didn't run, failed, or ran long. On its own it won't tell you why, because the stack trace still lives in your logs. You can send a short line to the /log endpoint to keep some context next to the alert, but for root cause you'll still want your existing logging. It's also a different job from checking whether your website answers outside traffic; that's uptime monitoring, a separate kind of check. If you're weighing where cron monitoring ends and server monitoring or full APM begins, we walked through the trade-offs in detail. One more limit worth naming: we evaluate schedules once a minute, so this isn't built for sub-minute jobs that need second-level precision.
If you also want a public status page showing cron health, that's built in too. For a fuller setup, including handling jobs that occasionally retry, the guide on monitoring cron jobs with a curl heartbeat and the one on debugging silent cron failures both go a layer deeper than this page.
Add one line to a crontab and know within the minute when a job misses, fails, or runs long. The free plan covers 20 checks with email and webhook alerts at no cost and no credit card; Slack, Telegram, and the rest come in on paid plans.
See plans and limits →Frequently Asked Questions
They overlap heavily. Heartbeat monitoring is the general technique, where a system reports in on a schedule and you get alerted when it goes quiet. Cron job monitoring applies that technique specifically to scheduled jobs run by cron and similar schedulers. WatchCron uses heartbeats to do both.
No. A monitor is a URL, so adding a single curl line to your job is enough to start. There's an optional CLI agent if you'd rather have your jobs registered and pinged automatically.
Each monitor has a grace period, five minutes by default and configurable per job, before a late check-in is treated as missed. Ordinary clock drift won't page anyone.
Yes. Send a start ping and an end ping, and if the measured duration crosses the threshold you set, the monitor raises a duration alert.
Anything that can make an HTTP request: curl, Python, Node.js, PHP, Laravel's scheduler, Kubernetes CronJobs, GitHub Actions, systemd timers, and the rest.
Start monitoring in under 2 minutes
Free plan includes 20 checks. No credit card required.
See Plans & Pricing