Cron Job Monitoring vs Server Monitoring vs APM: Which Do You Actually Need?
Stop throwing monitoring tools at your infrastructure randomly. Here's which monitoring approach actually makes sense for your setup.
 Vitalii Holben
The monitoring tool graveyard (and why most teams pick wrong)
You've got Datadog watching your servers, New Relic tracking your web app performance, and PagerDuty ready to wake you up at 3 AM. Your monitoring dashboard looks impressive. But last Tuesday, your database backup script failed three weeks ago and nobody noticed until you needed to restore something.
I see this pattern everywhere: teams collect monitoring tools like trophies but miss the actual issues that break production. They're watching CPU usage graphs while their scheduled jobs die in silence. They get alerts about disk space but never know their ETL pipeline stopped processing data.
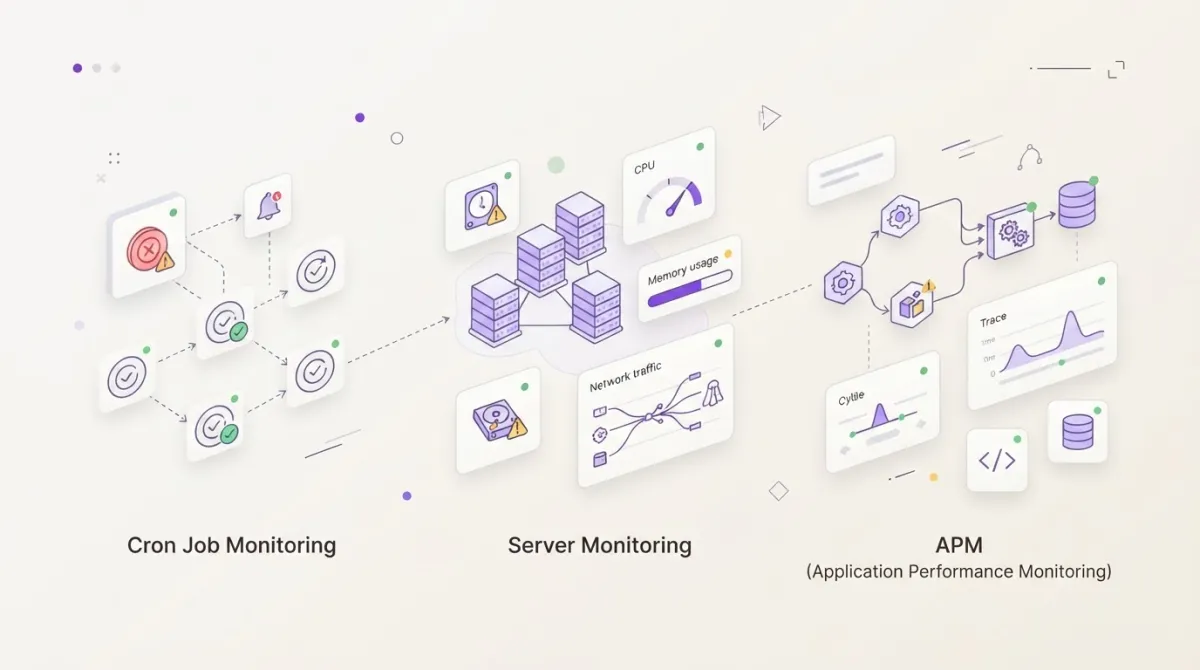
The problem isn't that these tools are bad. It's that most teams throw monitoring at their infrastructure without understanding what each type actually catches. Server monitoring, APM, and cron job monitoring solve completely different problems. Most setups are over-monitored in some areas and completely blind in others.
Server monitoring: watching the machine, missing the work
Server monitoring tools like Nagios, Zabbix, or cloud provider dashboards excel at one thing: telling you about hardware and operating system health. CPU usage, memory consumption, disk space, network traffic. If it shows up in top or iostat, server monitoring sees it.
Here's what server monitoring actually tells you: your machine is healthy. CPU at 15%, plenty of RAM available, disk I/O looking normal. Everything appears fine. But your nightly data processing job crashed two hours ago because of a database connection timeout, and server monitoring has no idea.
The blind spot is that server health doesn't equal application health. I've seen servers running perfectly while critical background processes fail for weeks. The cron daemon is running, the Python interpreter is available, disk space is fine, but the actual work isn't getting done.
Server monitoring catches infrastructure failures. When the disk fills up, when memory leaks crash processes, when the server becomes unresponsive, you'll know immediately. But it won't tell you that your backup script exits with an error code, or that your data sync job hangs waiting for an external API that's down.
APM: great for web requests, useless for background jobs
Application Performance Monitoring (APM) tools like New Relic, Datadog APM, or AppDynamics are built for web applications. They track HTTP requests, database queries, external API calls, and user interactions. For web apps, they're incredibly useful: slow endpoints, database bottlenecks, error rates, user experience metrics.
APM tools instrument your application code to trace requests through your system. They know when a web request takes 3 seconds instead of 200ms, when your database queries are inefficient, when third-party APIs are responding slowly. If a user can trigger it through your web interface, APM will track it.
But background tasks and scheduled jobs are invisible to most APM tools. Your nightly data export, hourly cache warming, or weekly report generation. These don't generate HTTP requests or user interactions that APM can trace. They run in isolation, often in separate processes, and APM has no visibility into them.
I've seen teams spend thousands on APM tools expecting them to catch cron job failures. The expensive mistake is assuming that application monitoring means monitoring all your applications. It usually means monitoring the user-facing parts of your application.
Cron job monitoring: the missing piece everyone forgets
Scheduled tasks need their own monitoring approach because they operate differently from web applications. Cron jobs fail in unique ways — they might run but do nothing, succeed but produce wrong results, or simply never execute.
When cron jobs fail silently, the impact builds over time. A failed backup script means no recent restore points. A broken data sync means reports show stale information. A crashed monitoring script means you're flying blind. These failures often go unnoticed for days or weeks because there's no immediate user complaint.
The difference between process monitoring and task completion monitoring is critical. Server monitoring might tell you the cron daemon is running. APM might catch errors if your web app triggers background jobs. But neither tells you if your scheduled database cleanup actually completed successfully.
Dead man's switch monitoring flips the logic: instead of watching for failures, it watches for missing success signals. Your cron job pings a monitoring endpoint when it completes successfully. If the ping doesn't arrive within the expected timeframe, you get alerted.
Real scenarios: which monitoring type catches what
Let me walk through four common failure scenarios to show which monitoring approach actually catches each problem.
Database backup fails but server looks fine: Your nightly backup script runs but can't connect to the database because credentials expired. Server monitoring sees normal CPU and disk usage. APM doesn't track the backup script. Only cron job monitoring would catch this, either through exit code monitoring or a missing success heartbeat.
Web app is slow but cron jobs work perfectly: A database query in your web application has become inefficient, causing 5-second page loads. APM catches this immediately with slow transaction traces. Server monitoring might show increased CPU usage. Cron job monitoring is irrelevant here since background tasks aren't affected.
Server crashes and everything stops: Hardware failure brings down the entire server. Server monitoring alerts immediately when the machine becomes unreachable. APM stops receiving data. Cron job monitoring notices missing heartbeats. All three catch this, but server monitoring catches it first.
Memory leak affects both web and background tasks: A memory leak gradually consumes all available RAM over several hours. Server monitoring alerts when memory usage hits 90%. APM shows increasing response times as the system struggles. Cron job monitoring might catch background tasks that fail due to out-of-memory errors. This scenario benefits from all three monitoring types.
The monitoring stack that actually makes sense
Start with server monitoring for infrastructure health. This is your foundation. You need to know when hardware fails, disks fill up, or the machine becomes unreachable. Tools like CloudWatch, Azure Monitor, or simple Nagios setups handle this well.
Add APM only if you have web application performance issues that you can't diagnose with logs and server metrics. If users complain about slow pages or you're losing revenue to performance problems, APM provides the visibility you need. But don't add APM just because you think you should. It's expensive and might not solve your actual problems.
Include cron job monitoring if you run any scheduled tasks that matter to your business. If you have database backups, data processing jobs, report generation, or any other scheduled work, you need visibility into whether these tasks complete successfully.
The key to avoiding alert fatigue is layering monitoring thoughtfully. Set conservative thresholds initially and tighten them based on actual incident patterns. Alert on things that require immediate action, not things that are just interesting to know.
Setting up basic cron job monitoring (the part most teams skip)
Here's how to add monitoring to an existing cron job using a simple heartbeat approach. I'll show you the basic pattern, then explain what to watch for.
# Original cron job
0 2 * * * /usr/local/bin/backup_database.sh

# Add monitoring with curl heartbeat
0 2 * * * /usr/local/bin/backup_database.sh && curl -fsS --retry 3 https://monitoring.example.com/ping/backup-job-uuid
This approach pings the monitoring endpoint only when the backup script succeeds (exit code 0). The && operator ensures the curl command only runs if the backup completes successfully.
For better monitoring, you can report both start and completion by modifying your script:
#!/bin/bash
# Signal job start
curl -fsS --retry 3 https://monitoring.example.com/ping/backup-job-uuid/start

# Run the actual backup
if /usr/local/bin/backup_database.sh; then
    # Signal success
    curl -fsS --retry 3 https://monitoring.example.com/ping/backup-job-uuid
else
    # Signal failure
    curl -fsS --retry 3 https://monitoring.example.com/ping/backup-job-uuid/fail
fi
This pattern lets your monitoring system differentiate between jobs that haven't started, jobs that are running, and jobs that completed successfully or failed. For Laravel applications, there's built-in support for heartbeat pings that makes this even simpler.
Beyond just "did it run," monitor what actually matters: backup file sizes, number of records processed, data quality checks, or external API response times. The specific metrics depend on what your job does, but completion status alone isn't always enough.
Common monitoring mistakes I see teams make
Over-monitoring creates more problems than under-monitoring. Teams set up alerts for every metric available, then ignore them when they fire constantly. I've seen monitoring dashboards with 47 different alerts, none of which trigger any actual response. Alert fatigue makes real incidents invisible in the noise.
The opposite mistake is assuming server health equals application health. Just because your servers are running doesn't mean your applications are working. Background jobs, scheduled tasks, and data processing pipelines can fail while server metrics look perfect.
Using the wrong tool for the job wastes money and creates blind spots. APM tools are expensive overkill for simple cron job monitoring. Server monitoring can't see application-level failures. Cron job monitoring won't catch performance problems in your web app.
False positives destroy trust in monitoring systems. If your alerts fire every time someone deploys code, or every time traffic spikes slightly, people stop responding to alerts. Set thresholds based on what actually requires intervention, not what's theoretically possible.
Your monitoring decision tree
Ask yourself these questions about your infrastructure to prioritize monitoring investments:
Do you run scheduled tasks that would break your business if they stopped working? If yes, you need cron job monitoring. Database backups, data imports, report generation, and cleanup jobs fall into this category.
Are users complaining about slow performance, or are you losing revenue to page load times? If yes, APM might help, but check your server resources and database performance first. Sometimes the answer is simpler than APM suggests.
Have you experienced server-level failures that took down your entire application? If yes, server monitoring should be your first priority. You can't fix what you can't see, and infrastructure failures affect everything.
How much time do you spend manually checking if things are working? If you're logging into servers to verify cron jobs ran, or manually testing application performance, you're probably missing monitoring in those areas.
Red flags that indicate missing monitoring include: discovering failures days or weeks after they happened, manually verifying that scheduled tasks completed, not knowing why your application performed poorly during specific time periods, or spending significant time troubleshooting issues that monitoring should have caught.
Stop guessing what broke and start monitoring what matters
Most monitoring strategies miss the scheduled task layer entirely. Teams monitor their web applications and servers carefully, but background jobs fail in silence for weeks. The impact compounds over time: stale data, missing backups, broken integrations.
Pick monitoring tools based on what actually breaks in your environment. If server crashes are your biggest problem, focus there. If users complain about performance, APM makes sense. If scheduled tasks fail silently, cron job monitoring fills that gap.
Tools like WatchCron exist specifically for the monitoring gap that APM and server monitoring miss. Set up monitoring once and get notified before things break, rather than discovering failures weeks later when you actually need the results of those scheduled tasks.
I hope this saves you from building the same monitoring graveyard I see at so many companies: lots of expensive tools that miss the actual problems.