Website Uptime Monitoring
A server can answer every request and still be broken. A deploy half-fails, the homepage starts returning a 500 wrapped in a friendly error page, and a monitor that only asks "did the server respond?" sees a reply and reports green. Your customers see the broken checkout; your dashboard doesn't. The same thing happens when a 200 comes back but the page is blank because an API behind it timed out.
Uptime monitoring is worth doing properly because "responded" and "working" aren't the same thing. WatchCron requests your URL on a schedule and checks what actually came back, so a site that's technically up but serving errors doesn't pass as healthy.
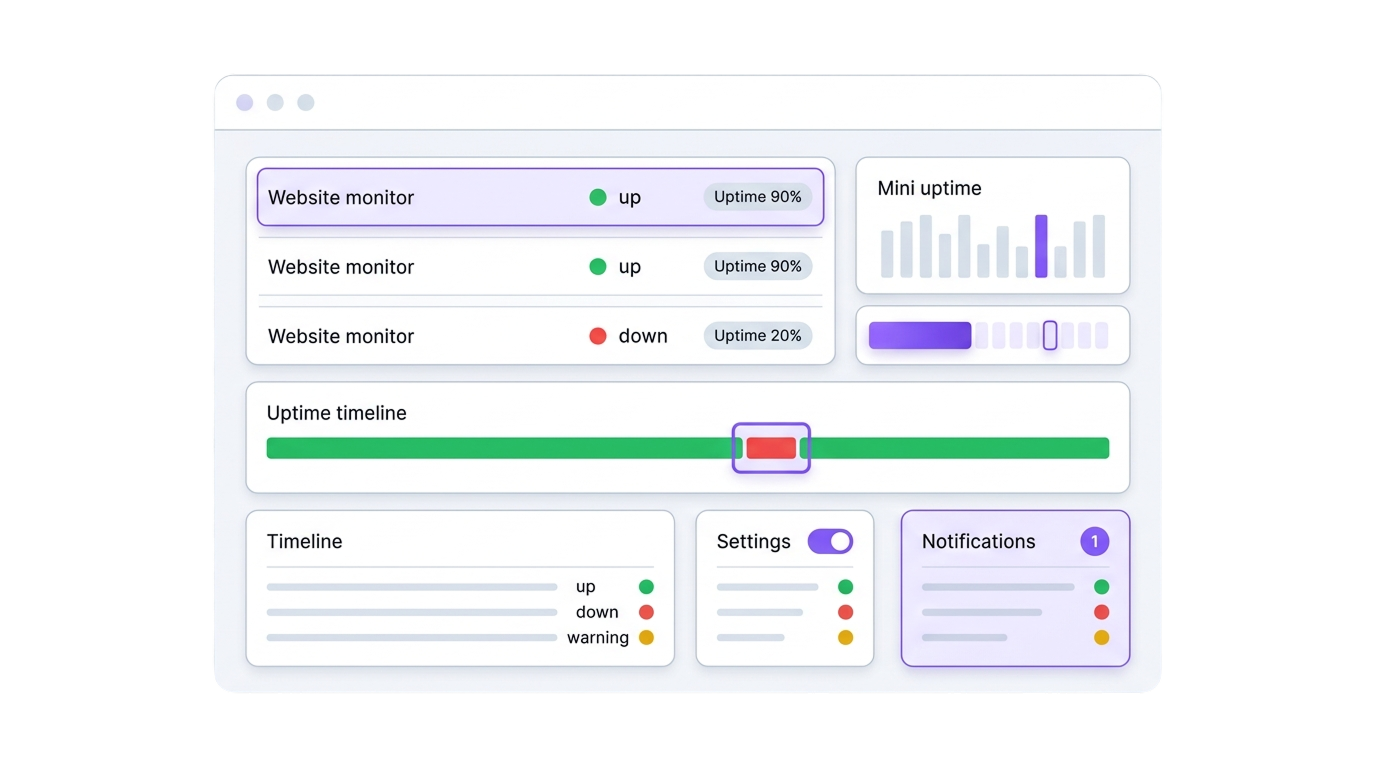
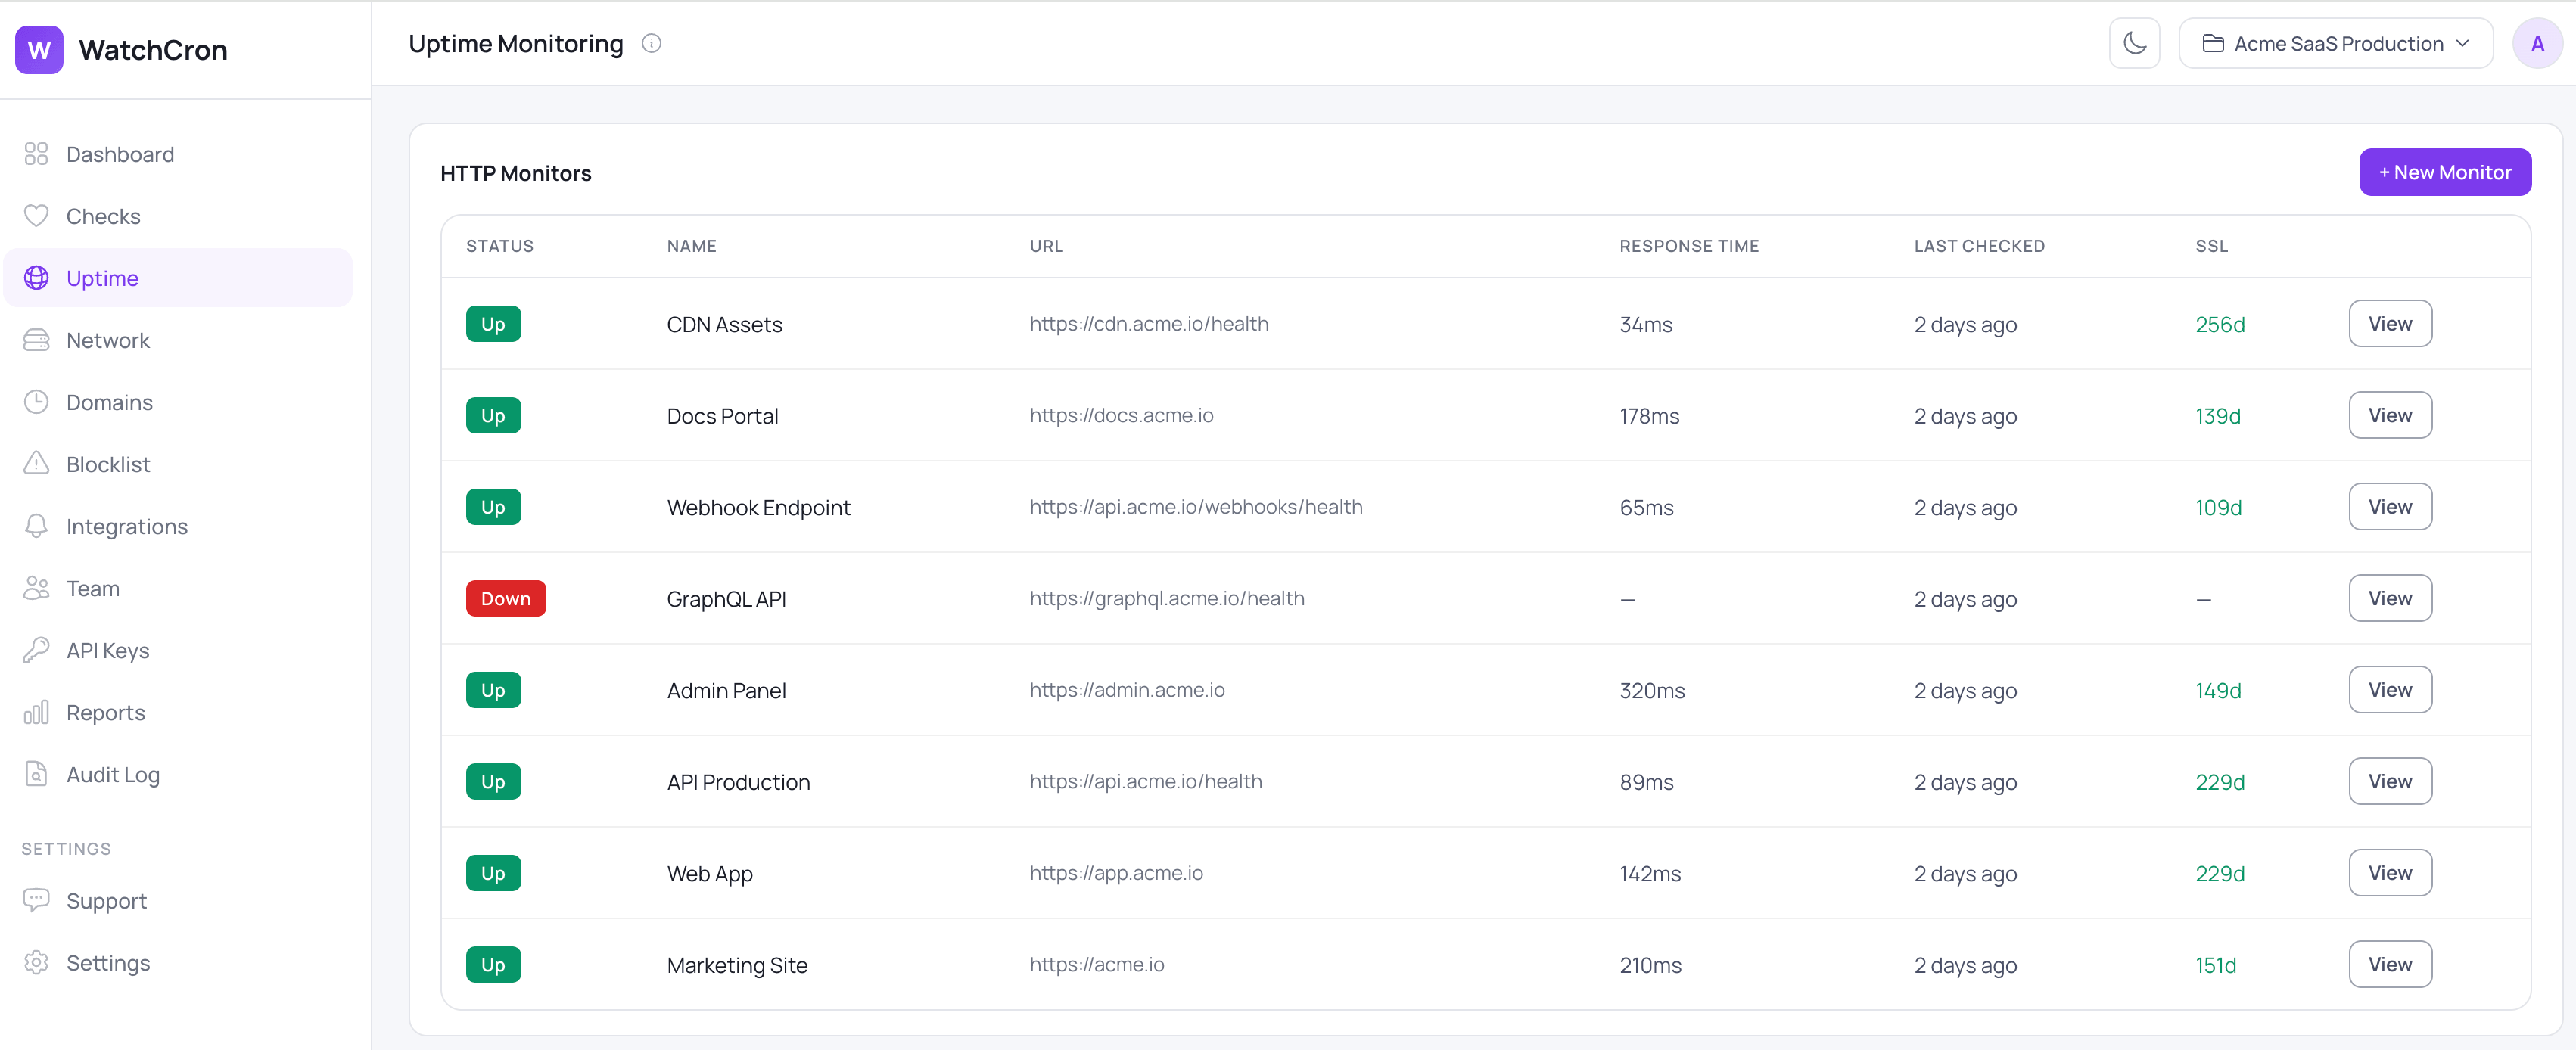
WatchCron keeps every site, API, and endpoint you care about on one screen, each with its current status, how long the last response took, and how many days are left on its certificate. A red row tells you something is wrong before a customer does, and the rest of this page walks through what each check looks at and how you're alerted when one of them turns.
How a check actually runs
You give us a URL, and we request it on a schedule, every five minutes by default and configurable to run more or less often. On each request we look at three things rather than one.
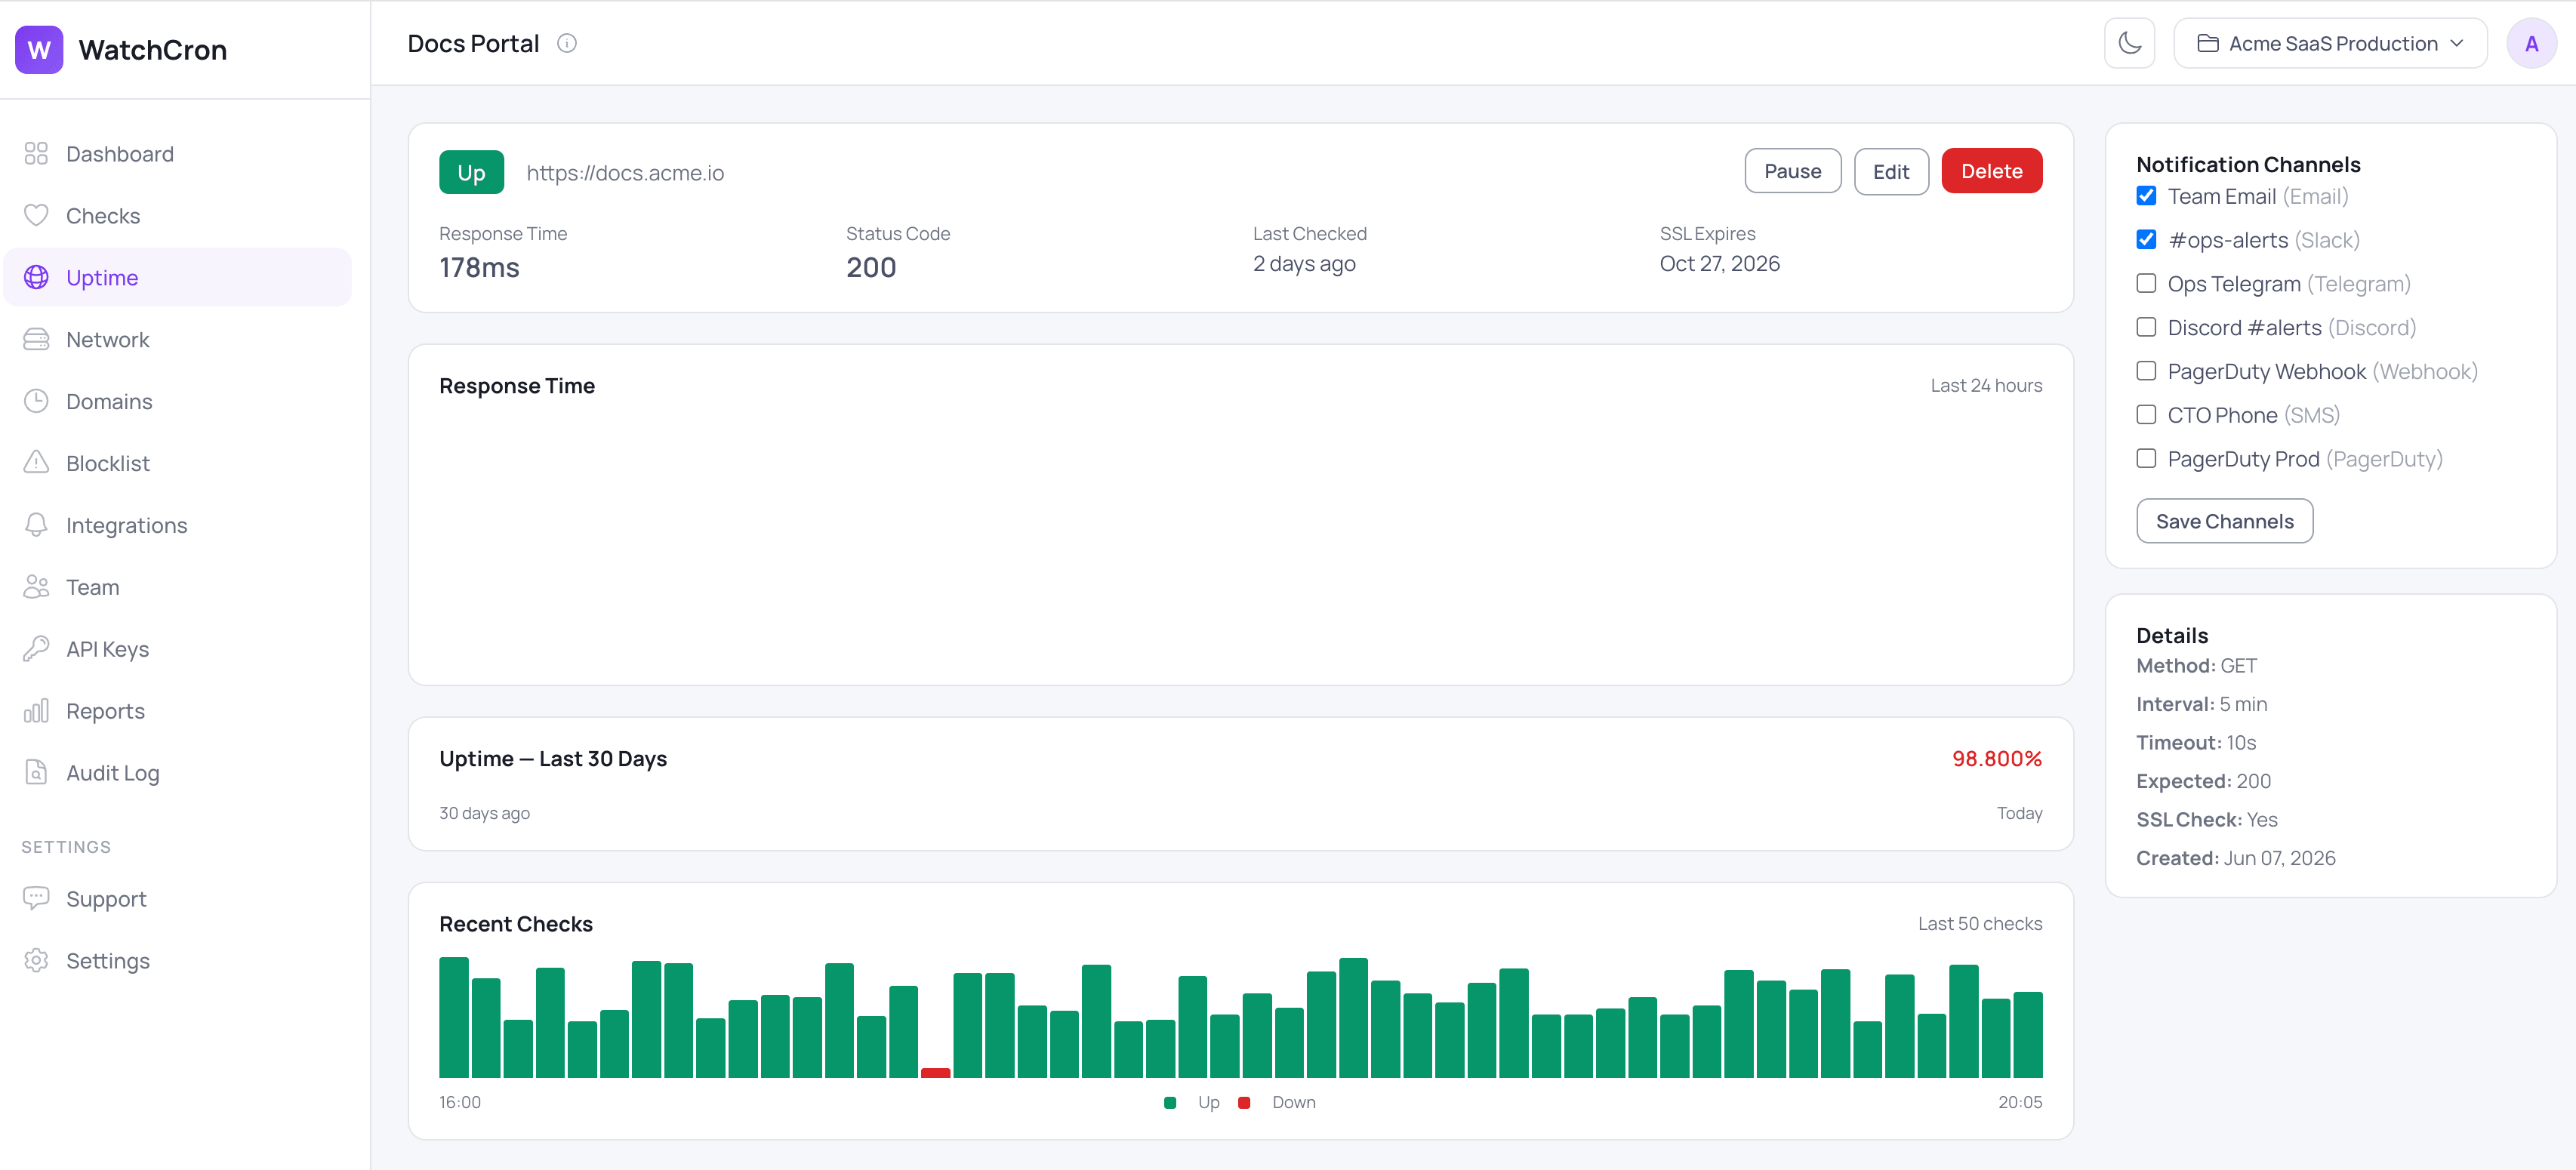
The first is the status code. We compare what the server returns against the code you expect, which is 200 by default but configurable, so an endpoint that's supposed to return 204 or 301 is judged against its own definition of healthy, not a generic one.
The second is a keyword. You can require a string that only appears when the page is genuinely working, for example a product price or a "Dashboard" label, and we flag the monitor as down if that text is missing. You can also invert it: name a string that should never appear, like "Fatal error" or "Service Unavailable", and we alert the moment it shows up. This is what separates a real page from an error page that happens to return 200.
The third is response time. We record how long each request took, in milliseconds, so you can see when a site starts trending slower before it tips into a real outage.
What a monitor watches, and what you can tune
Each HTTP monitor exposes the same controls, so you can match the check to what "healthy" means for that specific URL:
Capability | What it does | Default / control |
|---|---|---|
Status-code check | Confirms the response matches the code you expect |
|
Keyword check | Requires text to be present, or flags text that must be absent | Off until you set a string |
Response timeout | Counts a too-slow response as a failure | 10 seconds |
SSL expiry check | Warns before the certificate on an HTTPS URL runs out | On for HTTPS, alerts ahead (14 days by default) |
Response-time tracking | Records how long each check took, in milliseconds | Always on (tracked, not alerted on) |
Check interval | How often we request the URL | 5 minutes, configurable, the same on every plan |
Alert channels | Routes the alert to where your team works | Email and webhook on every plan, more on paid |
SSL expiry comes with the check
Because most sites worth watching are served over HTTPS, an expiry check on the certificate is built into HTTP monitoring rather than bolted on separately. When you monitor an https:// URL, we read the certificate's expiry date and warn you ahead of time, two weeks out by default, so a renewal you forgot doesn't turn into a browser warning on your checkout page. If you want a dedicated view of certificates across many domains, that lives in SSL certificate monitoring as its own feature.
Common uptime monitoring use cases
The check is flexible enough to cover most of what "is it working?" really means:
Marketing and landing pages, where a broken deploy is a lead-generation problem the day it happens, not the week you notice.
Public APIs and JSON endpoints, checked against the exact status code and a keyword from a known-good response body.
If a checkout or sign-up flow has to stay reachable, a keyword check on the page confirms it's serving the real form and not a cached error.
Login and dashboard pages behind a CDN, where the edge can report healthy while the origin is down.
Webhook receivers and callback URLs that quietly need to keep answering for integrations to work.
Where alerts go
WatchCron delivers alerts through ten channels. Email and webhooks work on every plan, including the free one. Slack, Telegram, Discord, and Microsoft Teams come in on Starter, SMS arrives on Pro, and phone-call, PagerDuty, and OpsGenie alerts are on Business for the endpoints you can't afford to have quietly fail.
What uptime monitoring won't do here
Being straight about the edges matters more than a longer feature list. Two limits are worth knowing up front.
We check from a single location, not a quorum of regions, so there's no "confirmed down from three continents" step before an alert. In practice a brief network hiccup between our checker and your server can register as a short blip. If you need multi-region confirmation as a hard requirement, this is the honest place to weigh it.
We track response time but don't yet alert on it on its own. You'll see when a site is trending slower in the logs, but a threshold like "page me if response time crosses 2 seconds" isn't available today. A timeout still counts as a failure at 10 seconds, so a fully hung request does alert.
It's also a different tool from cron job monitoring: uptime checks actively pull your URL, while cron monitoring waits for a job to check in. If you're sorting out where website checks end and server or application monitoring begins, we walked through the trade-offs in a separate comparison. Setup specifics live in the docs.
Point WatchCron at a URL and know when it returns the wrong code, serves an error page, or lets its certificate lapse. The free plan covers 20 checks with email and webhook alerts, no credit card, and the five-minute check interval is the same on every plan.
See plans and limits →Frequently Asked Questions
They're two halves of the same job from opposite directions. Uptime monitoring actively requests your URL on a schedule and judges the response. Cron job monitoring waits for your scheduled job to check in and alerts when it goes quiet. One pulls, the other listens.
Yes, that's what the keyword check is for. Require a string that only appears on a healthy page, or flag one that only appears on an error, and a 200 with the wrong content is treated as down.
Yes. When you monitor an HTTPS URL, the certificate's expiry is checked as part of the same monitor, with a warning ahead of time (14 days by default).
Every five minutes by default, and you can change the interval. It's the same on every plan, including free, so the check frequency isn't something you pay to unlock.
Not currently. Checks come from a single location, and there's no multi-region confirmation before an alert fires. It's a real limitation worth weighing if cross-region verification is a hard requirement for you.
Start monitoring in under 2 minutes
Free plan includes 20 checks. No credit card required.
See Plans & Pricing