Public status pages
When something breaks, your customers usually notice before your dashboard does. The first thing they do is refresh. The second is go looking for a status page: somewhere that confirms they're not the only one seeing it, and that someone is already on it. If that page doesn't exist, the next stop is your support inbox.
A public status page catches that. It's one URL you hand to customers, link from your app's error screen, or pin in a support reply, and it answers a single question in plain language: is the service up right now, and if not, what's being done. WatchCron builds the page from the monitors you already run, so there's no second dashboard to keep in sync. It's included on every plan, the free one too, with one status page per project and no limit on subscribers.
What it's for, and when you can skip it
A status page does a few jobs at once. Mostly it deflects support load: a page that already says "we know, here's where we are" answers most of the "is it just me?" messages before they're sent. It also buys you patience, since a customer who can see you spotted the problem nine minutes ago tends to wait rather than escalate. The slower payoff is trust. A visible 30-day history and a clean incident record say more than any number on a marketing page, partly because it's the same view your customers already see and you can't quietly edit last week.
The honest flip side: if you have a handful of users, no SLA, and a way to reach them all directly, you don't need one yet. The value shows up once you have customers you can't all message by hand, a contract that promises updates during incidents, or an open-source project strangers depend on.
Turning it on: one checkbox, one slug, one project
Enabling the page takes a single screen. In a project's settings, under Public Status Page, you tick "Enable public status page" and pick a URL slug, which becomes the address at watchcron.com/status/your-slug. An optional page title defaults to the project name, and a description of up to a thousand characters gives you room for a one-line summary like "Real-time status for all Acme services".
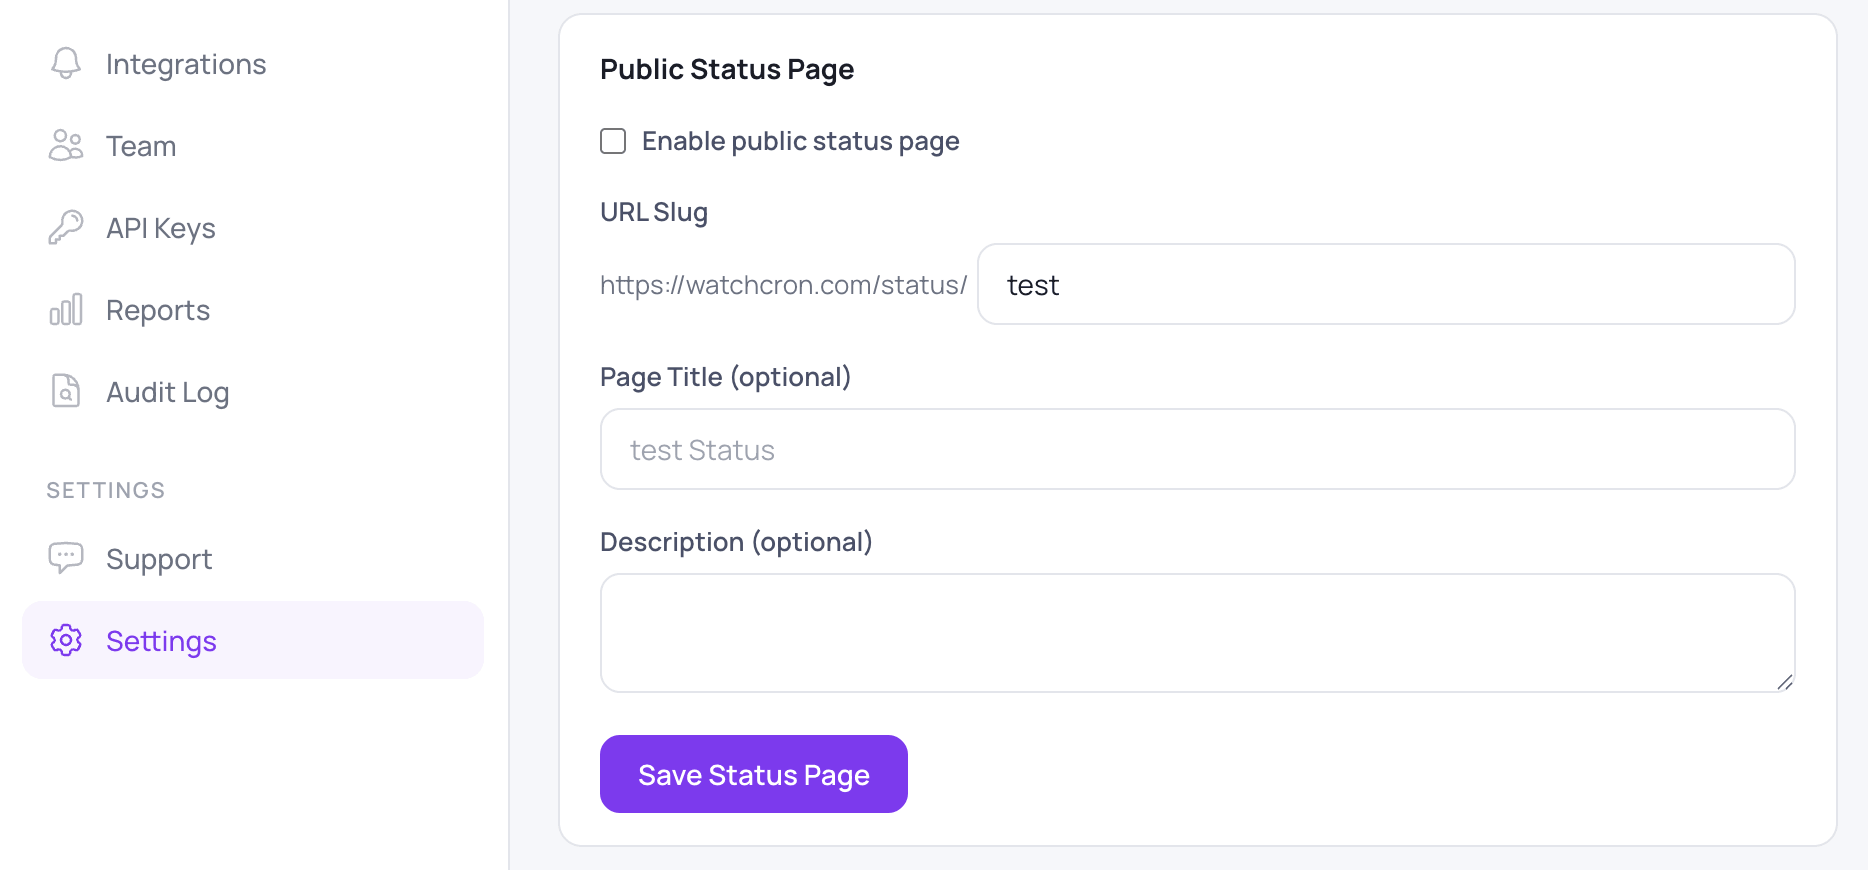
The page is tied one-to-one to a project, so it shows exactly that project's monitors and nothing else from your account. Keep separate projects per client or environment and each page surfaces only its own services. Once enabled it's live and public at that URL immediately, with no review step, so the moment to decide what's on it is before you flip the switch.
What a visitor sees
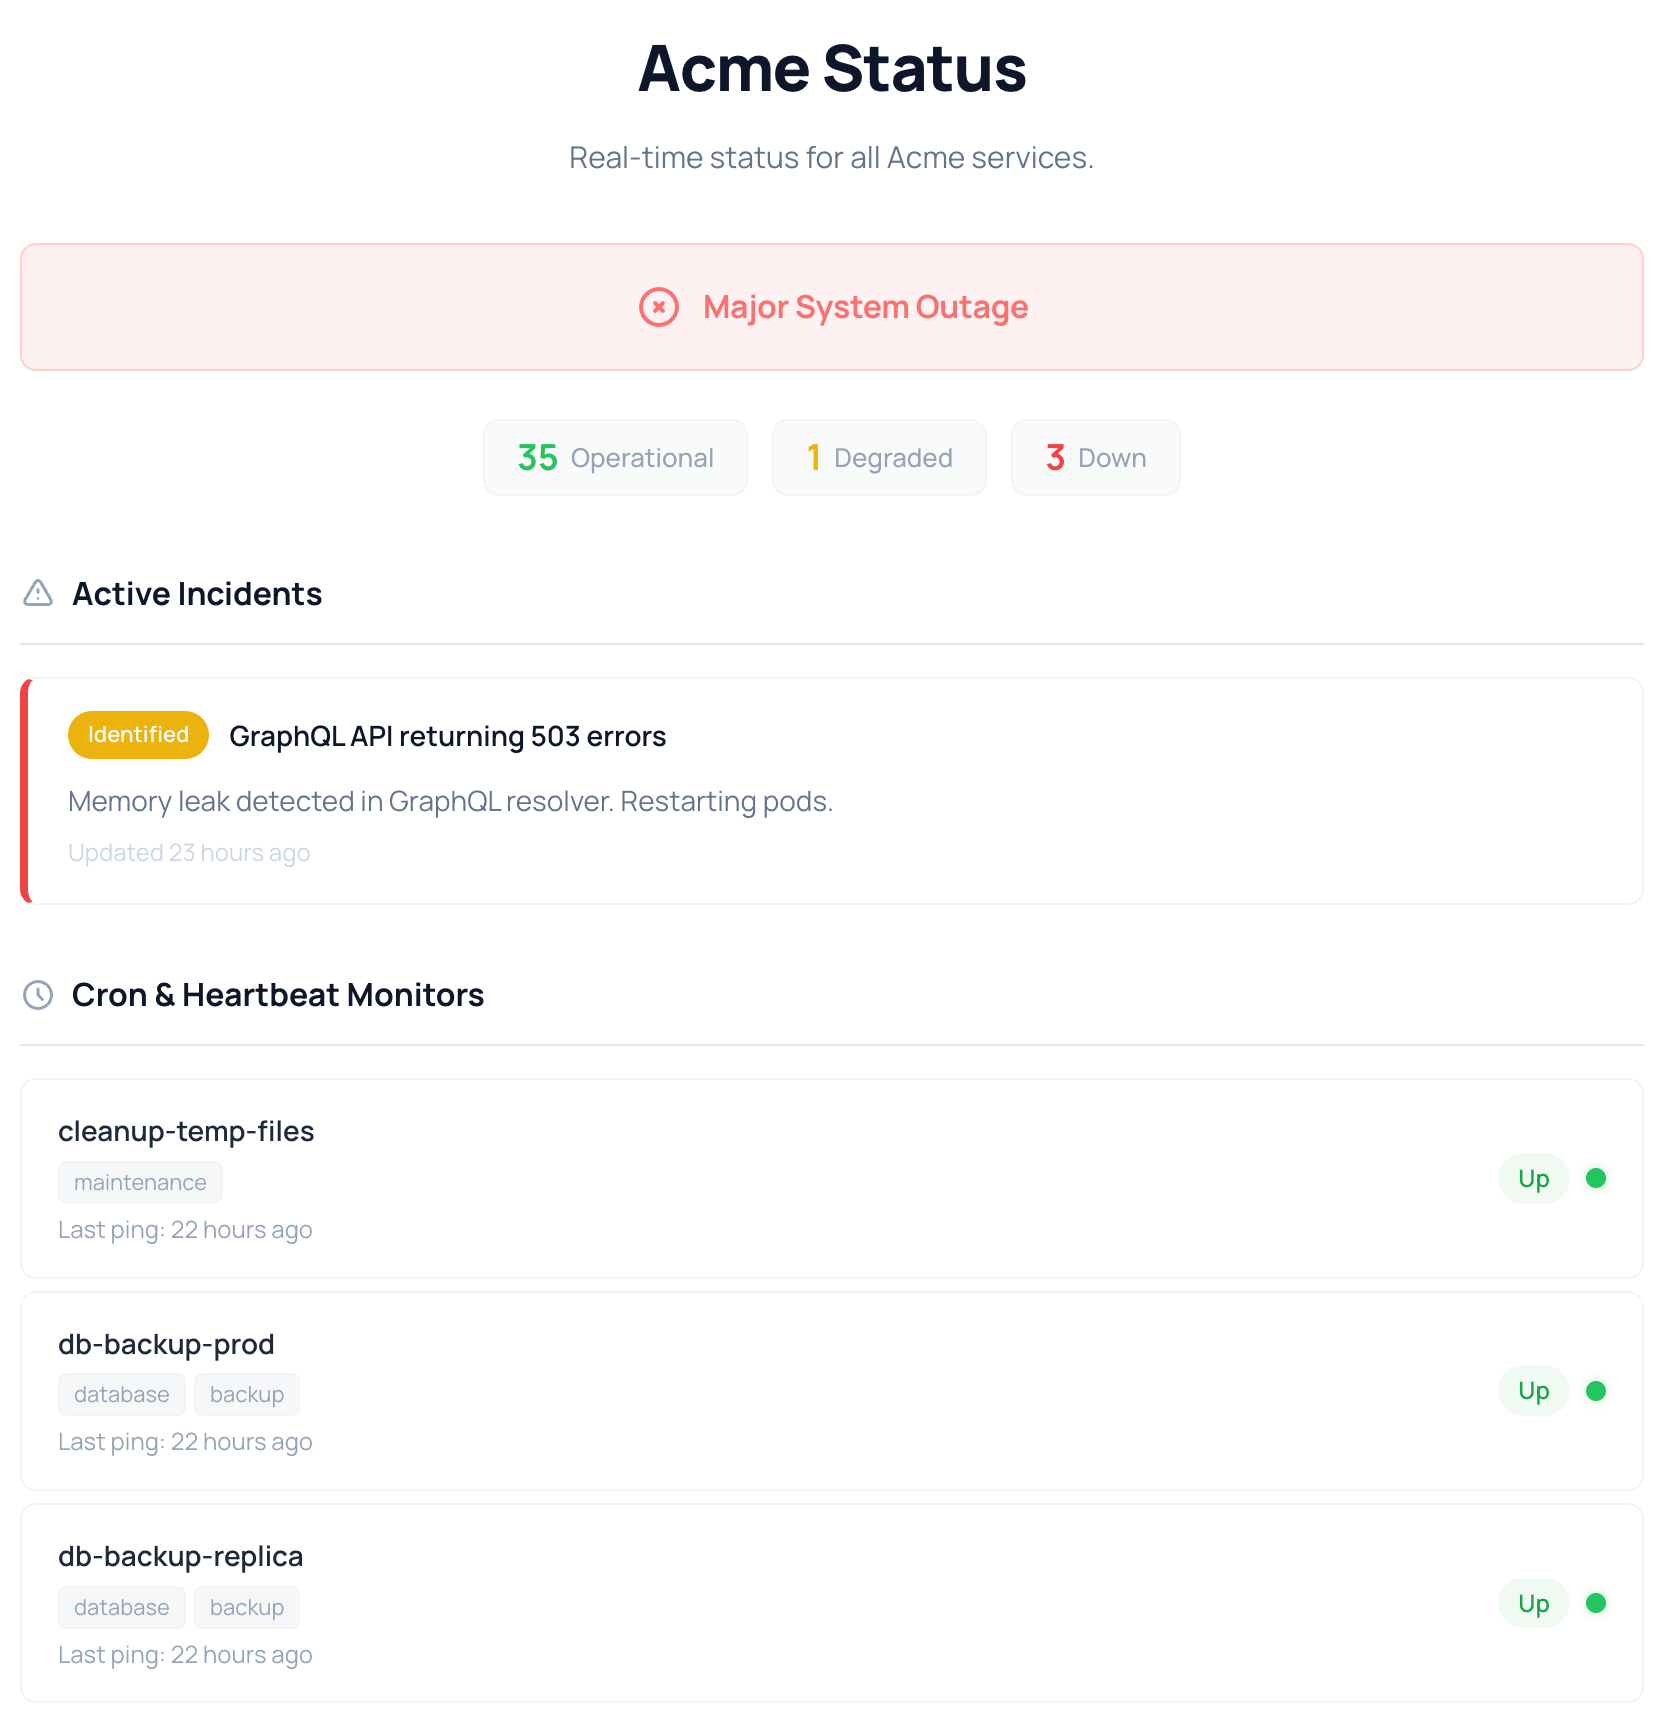
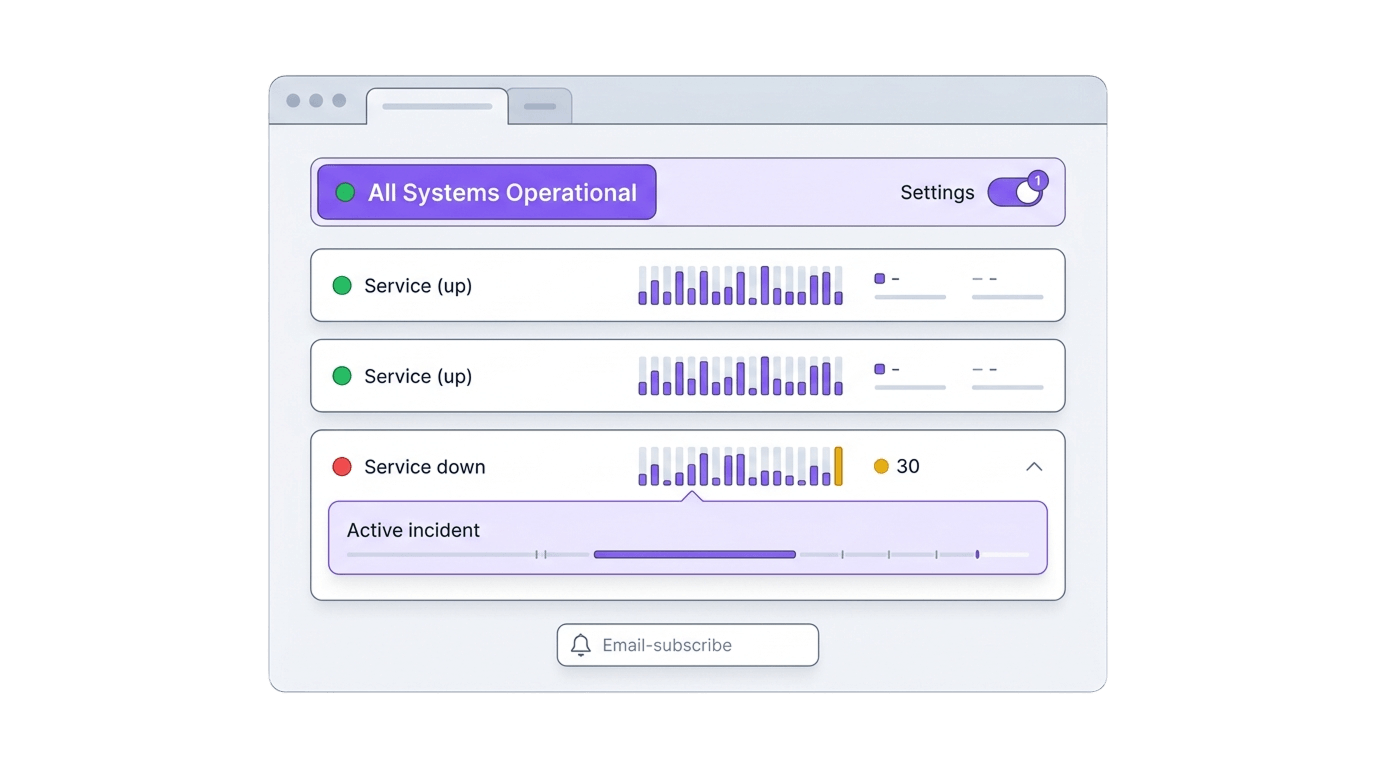
The top of the page is a single headline state, and we compute it from the monitors rather than asking you to set it by hand, because the one time you'd forget to flip a manual switch is the one time it matters. Everything healthy reads "All Systems Operational" in green; any monitor in its grace window (late, but not yet declared down) turns it amber for "Partial System Outage"; anything hard-down turns it red for "Major System Outage". A count sits under the banner, the "35 Operational, 1 Degraded, 3 Down" line that reads the whole situation at a glance. The banner reflects the worst current state, so a single Down outranks any number of healthy services, which matches how a customer thinks about an outage.
Each monitor carries a rolling 30-day uptime strip: one cell per day, green for clean, red for downtime, orange for a mixed day, with a hover tooltip for the date and a color-coded percentage next to it (green at 99.9%+, orange in the high nines, red under 99%). The strip shows the shape of the month, so a customer can tell whether a "99.7%" came from one bad afternoon or a dozen small flickers.
Three of the seven monitor types, each in its own section: your cron and heartbeat checks with name, tags, and last ping; your HTTP uptime monitors with response time; and your port and network monitors with protocol and host. Grouping is by type only, so there's no custom component grouping yet (you can't build an "API" or "Database" block). Two types stay off the public page on purpose: domain expiration and blocklist checks, and by the same logic SSL certificate checks, because a domain renewing in 40 days or a cert with 12 days left is a maintenance signal for you, not a "can customers use this right now" fact for them.
Incidents and the public timeline
Automatic detection is good for paging your team, but a bare "GraphQL API: Down" doesn't tell a customer you know, you've diagnosed it, or a fix is in flight. Incidents fill that gap, and you write them. You open one with a title, a message, and a starting status of Investigating, Identified, or Monitoring (you can't open it as Resolved, since an incident nobody worked is just noise). Each update after that carries its own message, status, timestamp, and author, so the timeline reads as a sequence. A concrete one from the demo: "GraphQL API returning 503 errors", opened at Identified with "Memory leak detected in GraphQL resolver. Restarting pods." That single specific line does more for trust than an hour of an unexplained red dot.
Three kinds of history are kept so it never looks suspiciously empty: open incidents at the top with their full timeline, incidents you resolved in the last seven days, and an automatically recorded list of up/down events going back 90 days (up to fifty entries) for blips you never wrote up.
This is where the feature meets incident management, and the line is worth drawing. Incident management is the operator's workflow: creating incidents, writing updates, moving them through statuses, resolving them. The status page is the public, read-only face of that work, plus the subscription that pushes your updates out. You write once; the status page is where the world reads it.
Email subscribers
Visitors can subscribe by email. They enter an address, confirm it through a verification link, and only then start receiving notifications, which keeps the list free of typo'd or maliciously-added addresses. Every email carries one-click unsubscribe.
The part worth knowing: subscribers are notified about the incidents you write, not every automatic blip. Opening, updating, or resolving an incident sends an email; the automatically detected events stay visible on the page but send nothing. A status page that emails people for a 30-second flap gets muted within a week, and a muted subscription is worse than none. These subscriptions are email-only, and they're separate from the Slack, SMS, and other routes you set up for multi-channel alerts, which page your own team rather than your customers.
Who runs one
In practice this fits SaaS companies linking the page from their app and docs, agencies running one page per client project (each client sees only their own services), open-source and infrastructure projects giving dependents a place to self-serve, and internal ops teams using it as a shared view during incidents. A pre-launch product with five beta users in a shared Slack can wait; an empty status page reads as either brand-new or abandoned.
A few things worth knowing before you turn it on
Your status page lives on a WatchCron subdomain, at watchcron.com/status/your-slug, rather than on your own domain the way the big public pages do (the status.stripe.com and githubstatus.com convention), and the look is fixed. So if a status page on your own domain, with your own branding, is a hard requirement, this isn't built for that. It's also a genuinely public page, with no private or password-protected mode, which is worth a moment's thought about which project you point it at and which monitor names you're happy to show.
For planned work there's no separate maintenance-window feature. The practical move is to open a manual incident as a heads-up before you start and resolve it when you're done, which keeps subscribers in the loop the same way a real incident would.
If you need a heavily branded page on your own domain with component grouping and SLA reporting, a dedicated status-page tool will serve you better. If you want a clean, honest, public page wired straight to the monitors you already run, on the same bill, with subscribers and a real incident timeline, that's the gap it fills.
Every plan includes public status pages at no extra cost. Enable one in project settings and your uptime, cron, and incident data goes public in seconds.
Get Started Free →Turn one on for a project you already monitor
Any project you're monitoring can have a status page turned on from its settings in under a minute, free plan included. See what each tier includes on the pricing page, or create an account and publish your first one.
Frequently Asked Questions
Yes, on every plan including Free. You get one status page per project, with unlimited email subscribers on all tiers.
Not currently. Pages are served at watchcron.com/status/your-slug, with no custom domain, logo, color theming, or favicon, and the "Powered by WatchCron" footer stays. You can set the page title, description, and slug.
Cron and heartbeat checks, HTTP uptime monitors, and port and network monitors, in three sections by type. Domain expiration and blocklist monitors don't appear, since they're maintenance signals rather than current-outage ones.
It's computed from the monitors. Everything healthy reads All Systems Operational; any monitor in its grace window reads Partial System Outage; anything down reads Major System Outage. The banner reflects the worst current state.
Yes, by email. They subscribe, confirm via a verification link, then get a message when you open, update, or resolve an incident, with one-click unsubscribe. Automatically detected events show on the page but don't email subscribers.
You can post incidents manually and move them through Investigating, Identified, Monitoring, and Resolved with a timestamped, attributed timeline. Scheduled-maintenance windows aren't supported yet.
Start monitoring in under 2 minutes
Free plan includes 20 checks. No credit card required.
See Plans & Pricing