Uptime Reports & PDF Export
When a client asks "what was our uptime last month?" — how fast can you answer? If the answer involves logging into three dashboards, exporting CSVs, and stitching numbers in a spreadsheet, the report takes longer to build than the downtime it describes. WatchCron generates uptime reports that cover every monitor type in one view, and lets you export, share, or schedule them without touching a spreadsheet.
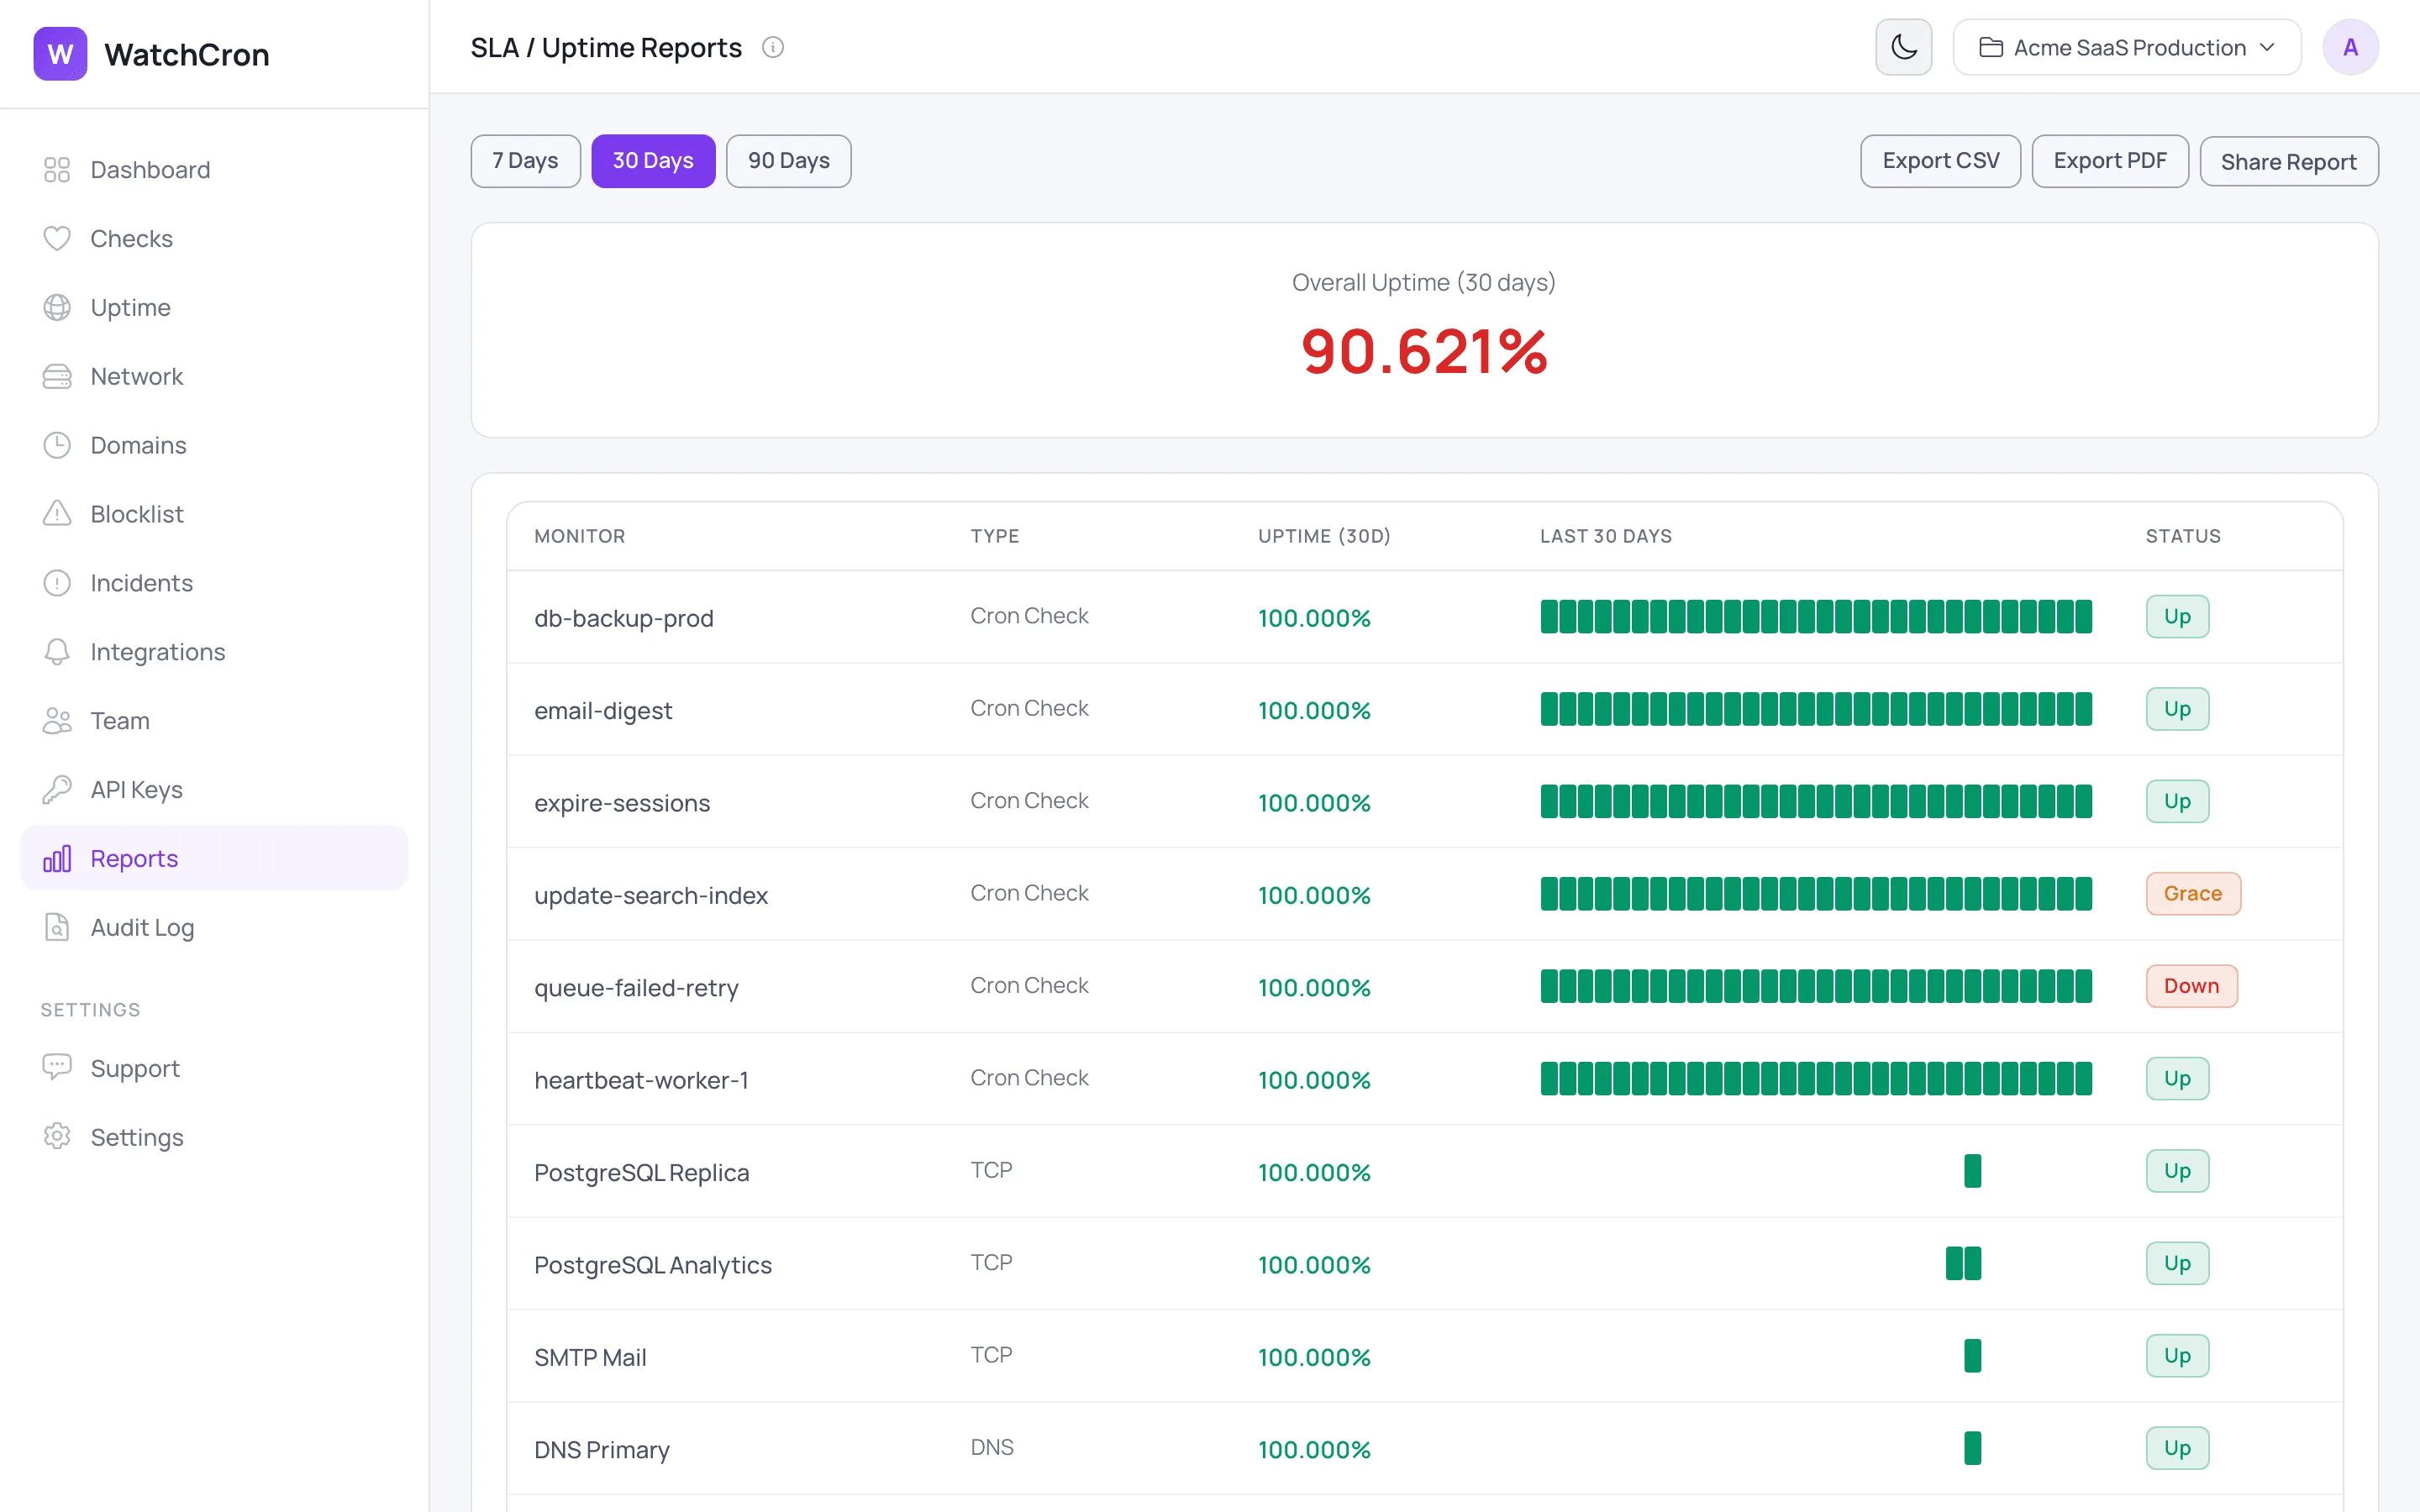
One report across all monitor types
Most reporting tools cover HTTP checks and stop there. Ours includes everything the project tracks: cron job monitors, uptime checks, port monitors, SSL, domain expiration, and blocklist scans. One dashboard, one export, one link to share.
For each monitor, the report shows:
- Uptime percentage over the selected period
- A day-by-day status bar — green for up, red for down, orange for mixed days
- Current status, last check time, and total checks performed
- Response time for HTTP and port monitors
At the top, a single number: overall project uptime, calculated as the average across all monitors. Color-coded at a glance — green above 99.9%, yellow above 99%, red below.
Pick your timeframe
Switch between 7, 30, and 90 days with one click. The 7-day view is useful for weekly standups. The 30-day view matches most SLA reporting cycles. The 90-day view gives you enough data to spot slow-moving trends — a server that degrades 0.1% per month won't show in a weekly snapshot but stands out over a quarter.
Export as PDF or CSV
Click the PDF button and download a clean, printable report. The file includes the project name, reporting period, generation date, and a table of every monitor with its uptime percentage and type. Hand it to a client, attach it to a contract review, or archive it for compliance.
Need the raw numbers? The CSV export adds columns for last ping time, next expected check, and total ping count — enough detail for anyone who wants to run their own analysis or feed data into another tool.
Both exports use the same period you selected in the dashboard. Filenames include the date and period length, so archived files stay organized.
Share a live report with a link
Not everyone who needs to see a report has a WatchCron account. Click "Share Report" and the system generates a unique URL tied to the current project. Anyone with the link can view the report — no login required. The data updates in real time, so the link stays useful long after you send it.
This works well for agencies reporting to clients, or for teams that want a read-only view on a wall-mounted screen. The link shows the same data, the same status bars, and the same period selector you see in the dashboard.
Weekly digest by email
Every week, WatchCron sends a digest email to every verified user. It summarizes each project: how many checks are up, how many are down, how many status flips happened during the week, and total pings received. If anything is currently down, the digest lists those checks first.
The digest is not a replacement for the full report. It is a pulse check — a five-second scan that tells you whether something needs attention before you start your day. If a number looks off, one click takes you into the full dashboard.
Reports are scoped to projects
If you manage monitors for multiple clients or environments, each project generates its own report. A shareable link for "Acme Production" shows only Acme's monitors — nothing from your other projects leaks through. This makes project-scoped reports safe to hand directly to a client without redacting anything.
Need to configure alert channels differently per project? That works the same way. Channels, monitors, reports, and team access are all isolated at the project level.
What reports don't do yet
Scheduled PDF delivery by email is not available yet — you download the PDF manually or share the live link. Custom branding (logo, colors) on exported PDFs is also on the roadmap. If either of these would change how you work, let us know — it helps us prioritize.
Frequently Asked Questions
Start monitoring in under 2 minutes
Free plan includes 20 checks. No credit card required.
See Plans & Pricing