REST API & Status Badges
You already automate deploys, provision infrastructure from config files, and manage secrets through a CLI. Monitoring shouldn't be the thing you still click through a dashboard to set up. Our API lets you script everything — create checks, adjust schedules, pull history — and the badge endpoints give you a live status indicator you can drop into a GitHub README or internal wiki without writing any glue code.
What the API covers
The REST API sits at /api/v1 and follows standard conventions. Bearer token authentication, JSON request and response bodies, meaningful HTTP status codes, paginated lists. No SDK required — a curl command or any HTTP library works.
Here is what you can do:
- Checks — list, create, read, update, delete. Set the schedule (cron expression or simple interval), grace period, timezone, and tags. Pause or unpause a check with a single PATCH request.
- Ping history — retrieve the log of every ping a check received: timestamps, source IPs, request method, body content, and duration.
- Status flips — pull the timeline of state transitions (up → grace → down → up) for any check.
- Channels — list the notification channels configured for the current project, including how many checks each channel covers.
Every response returns clean JSON. List endpoints paginate automatically — you control page size through the per_page parameter and filter checks by tag.
Authentication and rate limits
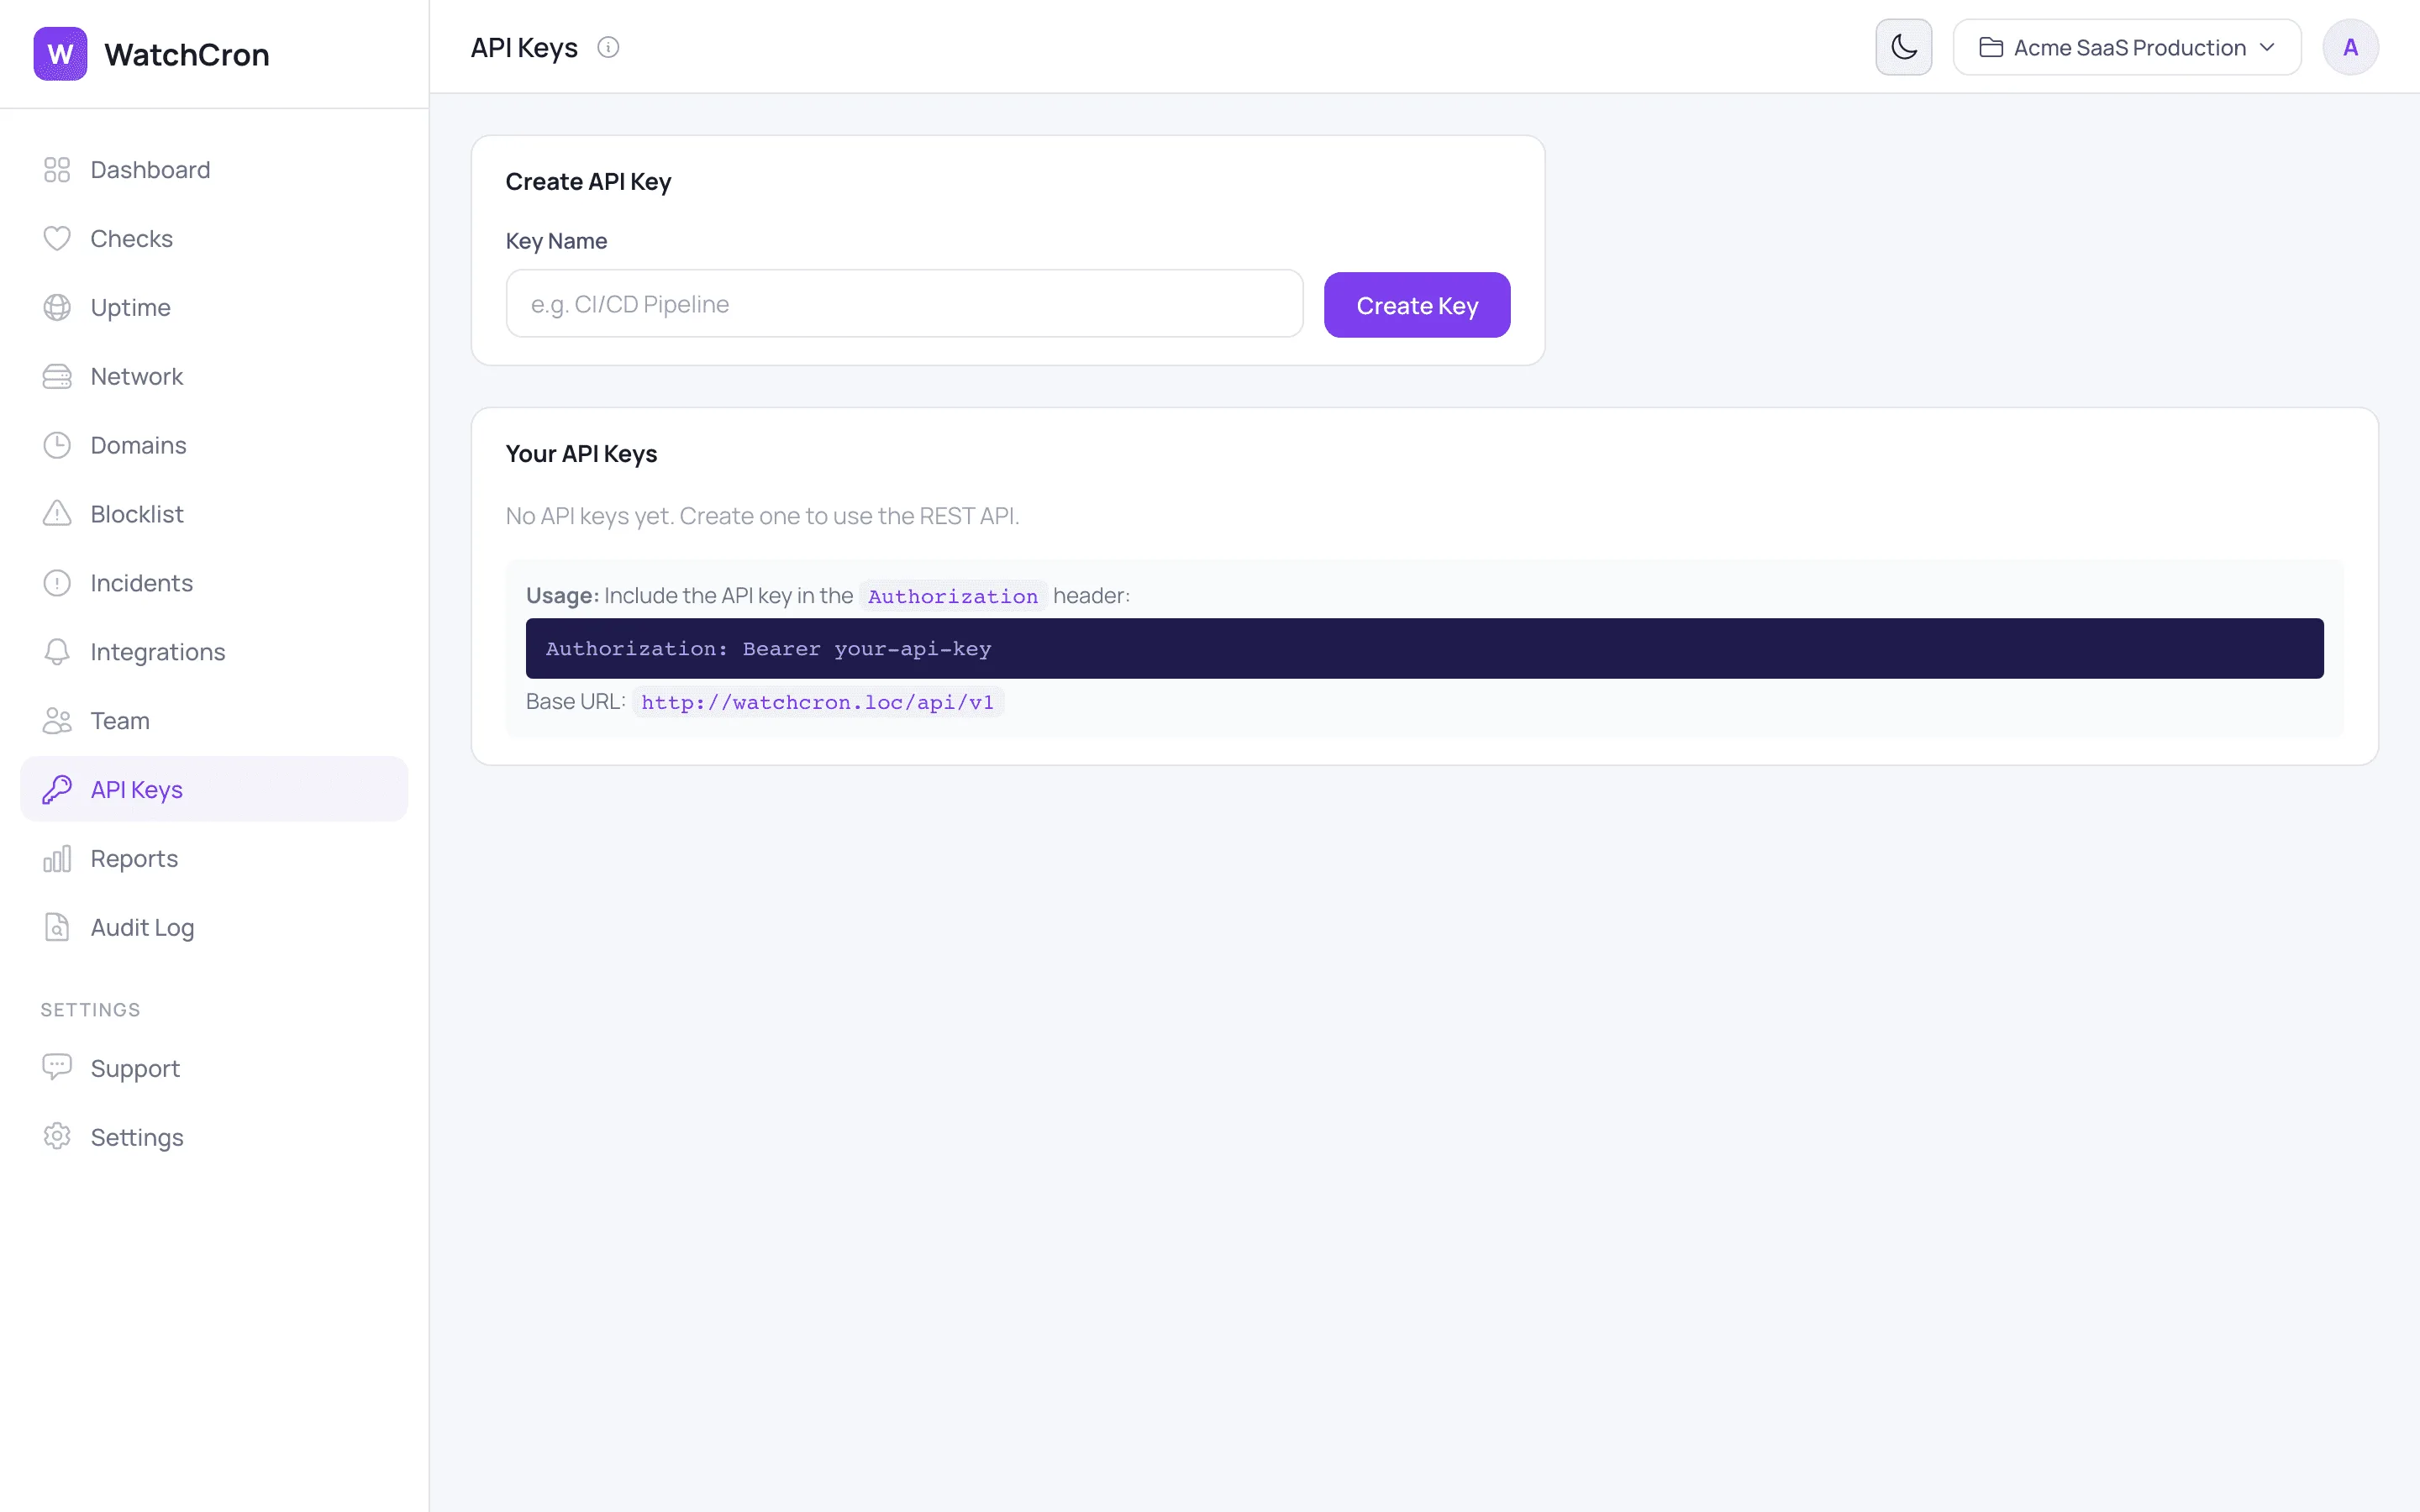
Each project gets its own API keys. You generate them inside the dashboard, give each key a name that describes its purpose ("CI pipeline", "Terraform provisioner"), and store the token in your secrets manager. The key is shown once on creation and stored only as a SHA-256 hash — we cannot retrieve it for you later.
Pass the key as a Bearer token:
curl -H "Authorization: Bearer YOUR_API_KEY" \
     https://watchcron.com/api/v1/checks
Rate limits scale with your plan:
| Plan | Requests / minute |
|---|---|
| Free | 100 |
| Starter | 200 |
| Pro | 500 |
| Business | 1,000 |
If you hit the limit, the response includes a Retry-After header with the number of seconds to wait.
Ping endpoints need no key at all
The heartbeat ping URLs are separate from the management API. Your cron job calls /ping/{uuid} to report success, /ping/{uuid}/start to mark the beginning of a run, or /ping/{uuid}/fail to signal an explicit failure. These endpoints accept both GET and POST, return instantly, and have no rate limit — they are built for machines that report every minute or more often.
You can also POST to /ping/{uuid}/log to attach up to 100 KB of log output. When a job fails, the log content shows up in the alert so your team sees the error without SSH-ing into the box.
Status badges you can embed anywhere
Badges are auto-generated SVG images that reflect current status. They follow the same color language you see in the dashboard: green for up, red for down, orange for grace period, blue for paused.
Three badge types are available:
- Single check —
/badge/{uuid}.svg— shows the check name and its current status. - Tag —
/badge/{apiKey}/{tag}.svg— aggregates all checks tagged with a label likeproductionorpayments. - Project summary —
/badge/{apiKey}/summary.svg— one badge for the entire project, showing how many checks are up.
Embed one in a GitHub README with a single Markdown line:
Badges cache for 30 seconds. After a status change, the new color appears within half a minute — fast enough for real-time awareness, light enough that a popular repo won't hammer the server.
What teams actually automate
The API is not a checkbox feature. These are patterns we see in production:
- CI/CD provisioning. A deploy pipeline creates a heartbeat check for each new service, tags it with the environment name, and assigns it to the right alert channel. When the service is decommissioned, the pipeline deletes the check.
- Custom dashboards. Pull check statuses and flip history into Grafana, a Notion embed, or a TV-mounted board. The JSON responses need no transformation.
- Bulk management. Pause all checks in a staging environment before a load test, unpause them when it finishes. One loop, one PATCH call per check.
- External reporting. Combine flip data with your own metrics to build uptime reports that match your SLA definitions, not ours.
Quick-start example
Create a heartbeat check that expects a ping every hour with a five-minute grace period:
curl -X POST https://watchcron.com/api/v1/checks \
  -H "Authorization: Bearer YOUR_API_KEY" \
  -H "Content-Type: application/json" \
  -d '{
    "name": "Nightly DB Backup",
    "schedule_type": "cron",
    "cron_expression": "0 2 * * *",
    "timezone": "Europe/Berlin",
    "grace_seconds": 300,
    "tags": ["production", "backups"]
  }'
The response includes the ping_url your script should call on success. Add it to the last line of your backup script and you are covered — if the job fails, stalls, or never starts, WatchCron notices the missing ping and alerts your team through whichever channel you configured.
What the API does not cover yet
Honesty saves you time. The v1 API manages cron/heartbeat checks and lists channels. It does not yet cover HTTP monitors, port monitors, SSL checks, domain expiration, blocklist monitors, incidents, or status page configuration. Those endpoints are in progress. If an endpoint matters to you, let us know — it moves up the list.
Frequently Asked Questions
Start monitoring in under 2 minutes
Free plan includes 20 checks. No credit card required.
See Plans & Pricing