Port & Network Monitoring
Your website can be up while the things it depends on are down. The marketing site answers fine, but Postgres stopped accepting connections on 5432 after a config reload, and now the app is throwing 500s on every page that touches the database. An HTTP check on the front door doesn't see it, because the database lives on a different box and doesn't speak HTTP at all.
Most of an application sits on a stack of services that never serve a web page: databases, caches, queues, mail servers, DNS. Port and network monitoring watches those directly. WatchCron opens a connection to a host and port on a schedule, or resolves a DNS record, or pings a host, and tells you the moment the service stops answering.
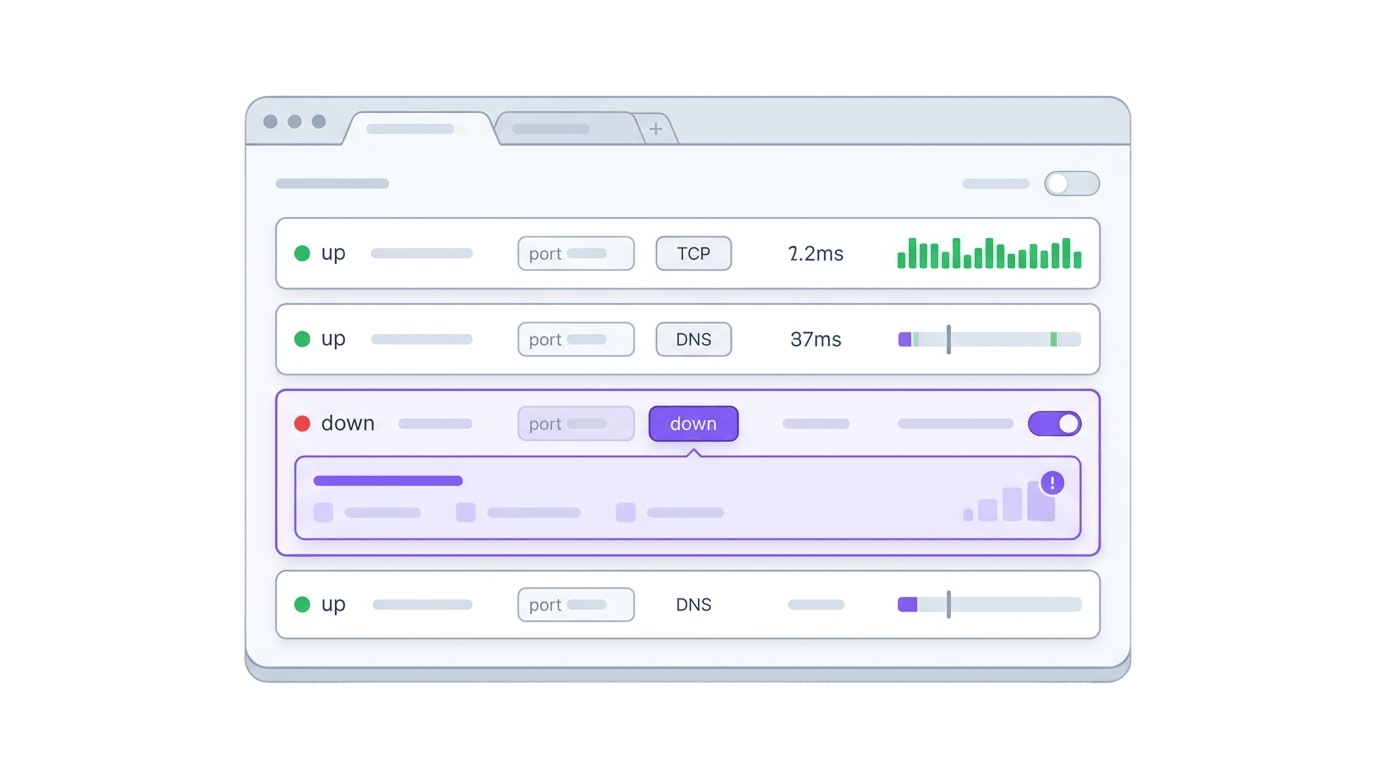
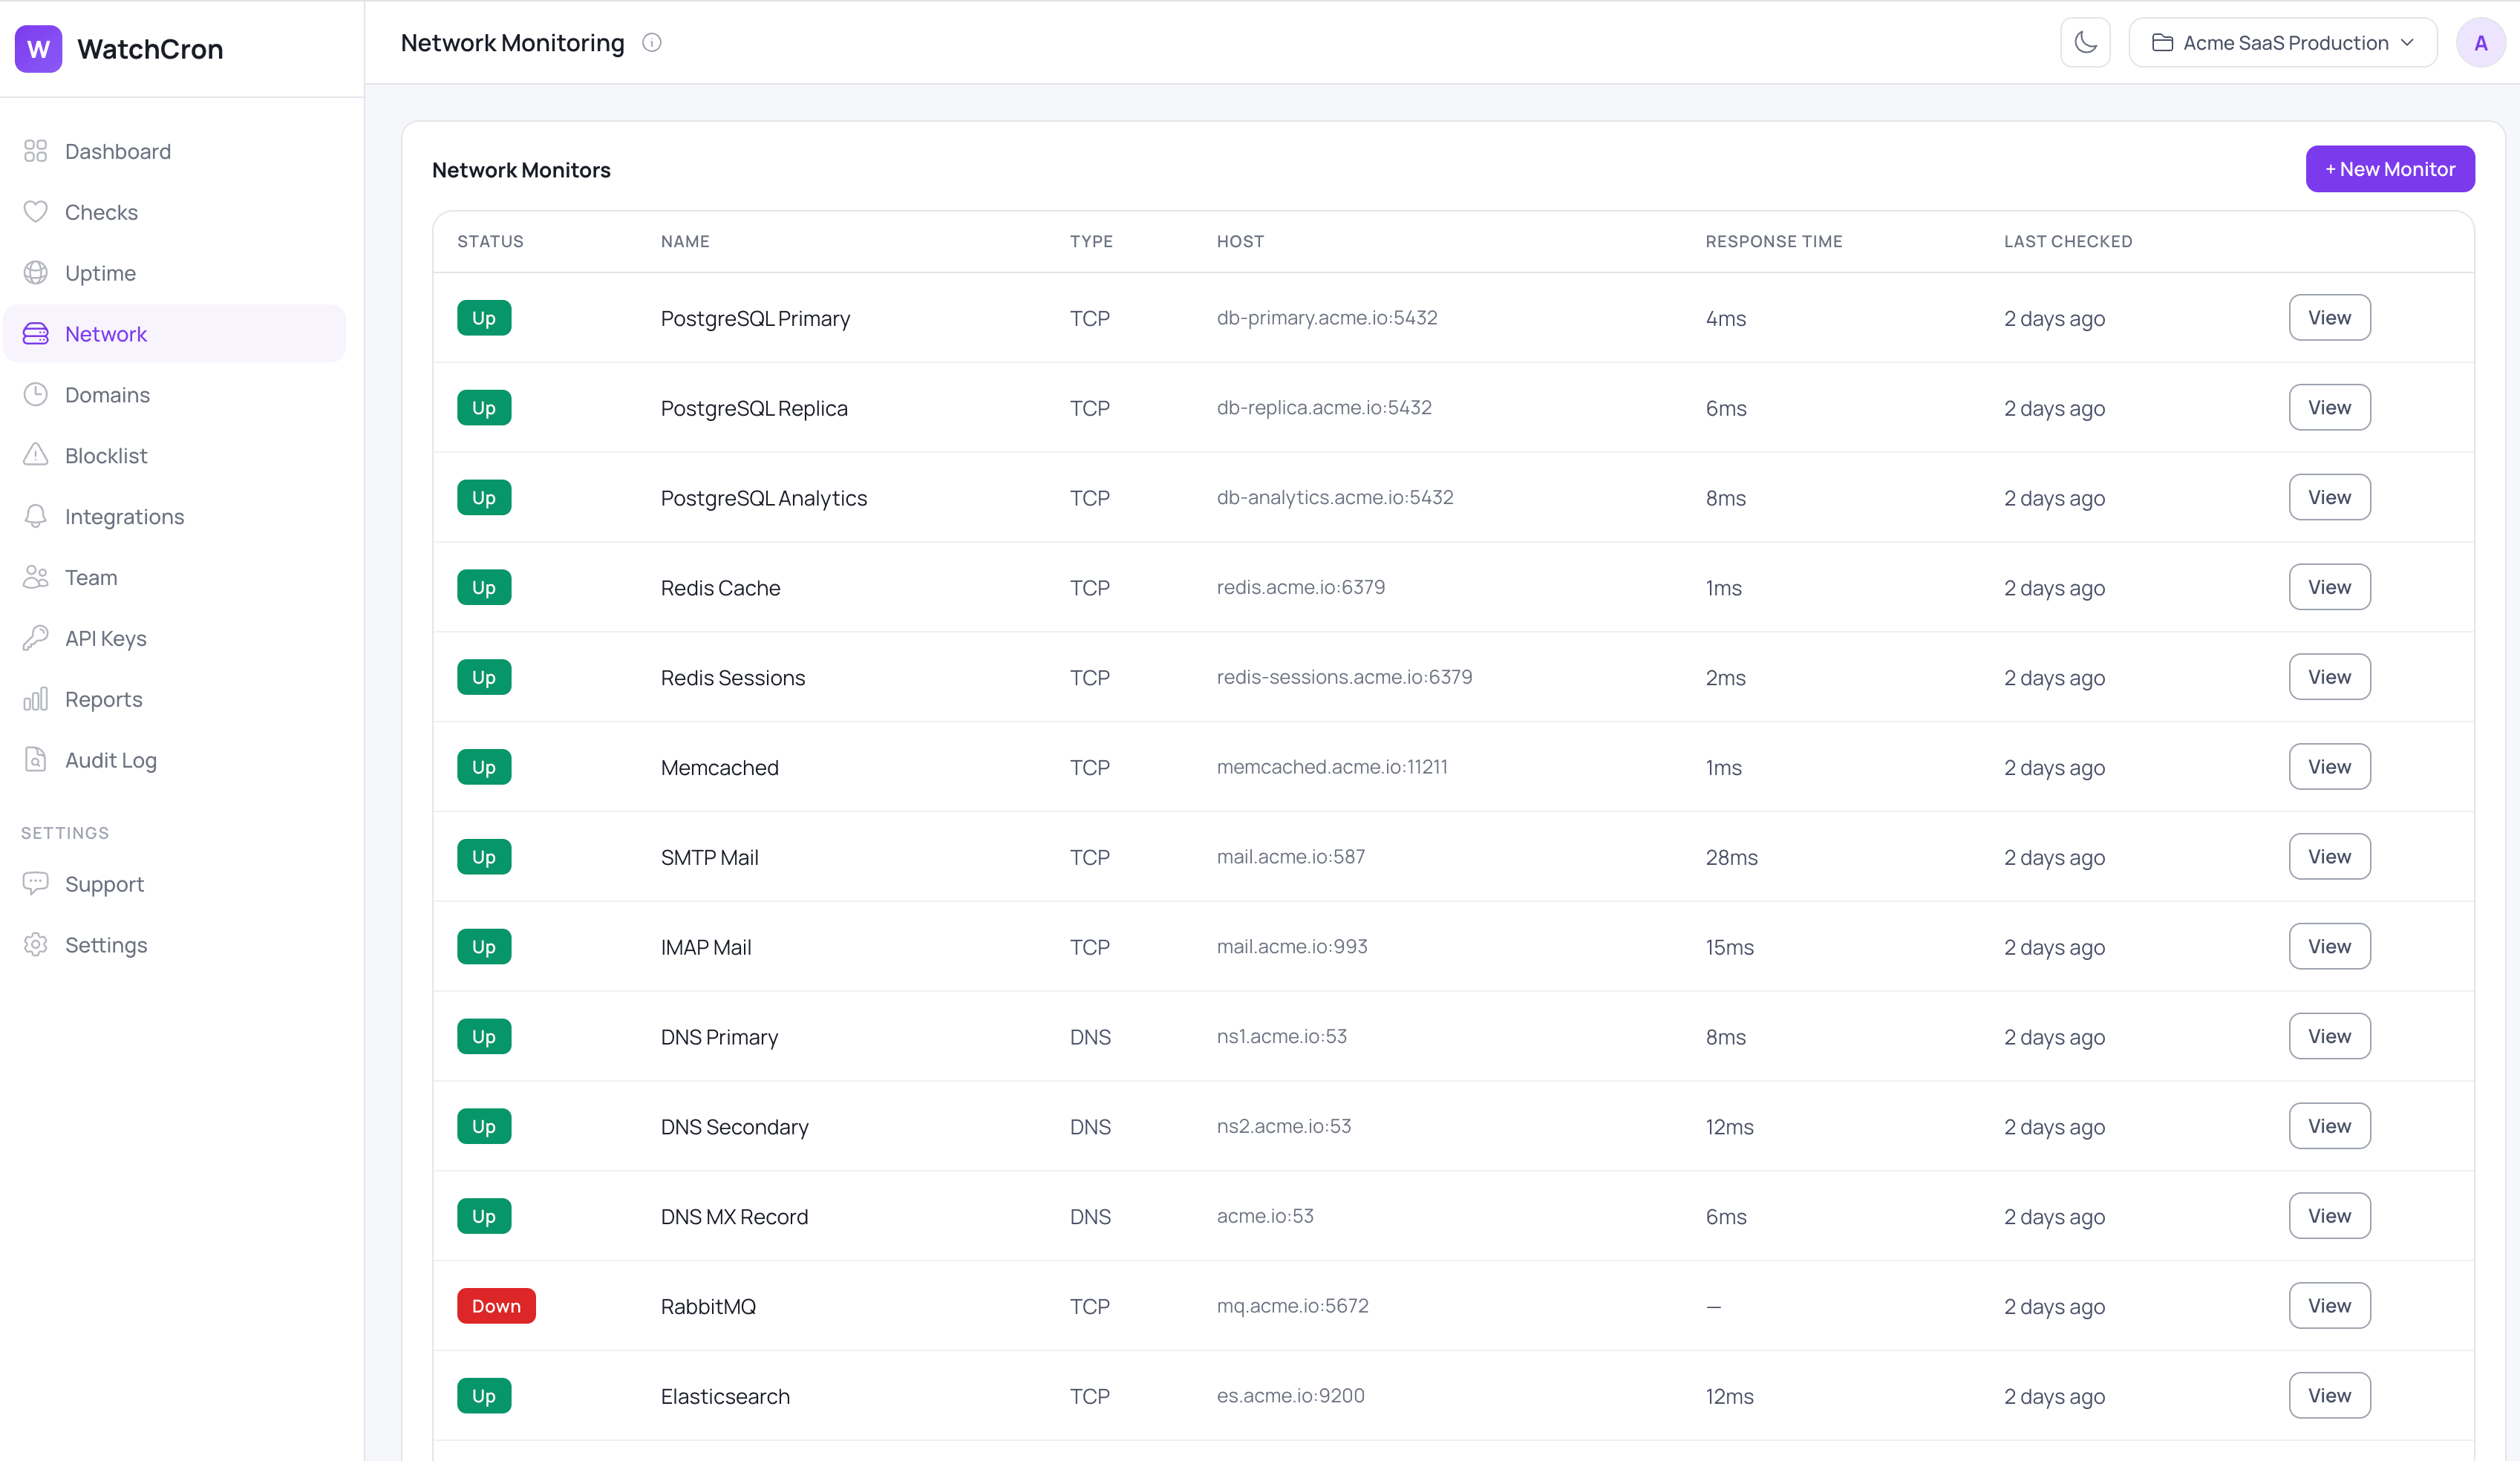
Network monitors sit on their own screen, each row showing the protocol, the host and port, the last response time, and whether the service is currently answering. A database, a cache, a mail server, and a DNS resolver can all sit side by side, and a red row points you at the one piece of infrastructure that's actually down.
Four kinds of check, one monitor type
A network monitor has a type, and each type answers a different question about a service.
A TCP check opens a connection to a host and port. If the connection is accepted, the service is up; if it's refused or times out, it's down. This is the workhorse, the one you'll reach for to watch Postgres on 5432, Redis on 6379, SMTP on 587, or SSH on 22.
A UDP check attempts a UDP socket to the host and port. Because UDP is connectionless, this is a deliberately weak signal: the service reads as up as long as the socket can be created, and only reports down when it can't. It's covered below in the limits, because it's easy to over-trust.
A DNS check resolves a record of the type you choose, A, AAAA, MX, CNAME, TXT, or NS. If no record comes back, it's down. And if you set an expected value, the resolved record is compared against it, which is where DNS monitoring earns its keep.
An ICMP check sends a single ping. A reply means up; a non-zero result means down. It's the simplest signal and the easiest to misread, for reasons in the limits section.
You set the host, the port (required for TCP and UDP), the DNS record type and optional expected value, a timeout from 1 to 60 seconds, and a check interval from 30 seconds up to a day. The default timeout is 10 seconds and the default interval is 5 minutes.
What each protocol checks, and when it counts as down
Protocol | What it checks | Counts as down when |
|---|---|---|
TCP | A connection to | Connection refused, or it times out |
UDP | A UDP socket to | The socket can't be created (a weak signal — see limits) |
DNS | A record of the chosen type resolves, and matches the expected value if set | No record returns, or the resolved value doesn't match what you expected |
ICMP | A single ping gets a reply | The ping returns a non-zero result |
Catch DNS that resolves to the wrong place
A domain that resolves is not the same as a domain that resolves correctly. Set an expected value on a DNS monitor, and WatchCron compares the record it gets back against the one you told it to expect, flagging the monitor down when they don't match. That catches the failure modes a plain "does it resolve" check sails past: a DNS hijack pointing your domain at someone else's server, a migration that updated the wrong record, or an expired domain quietly handed to a parking page. The resolved value is saved with the check, so you can see exactly what it returned instead.
What's tracked, and what you'll see
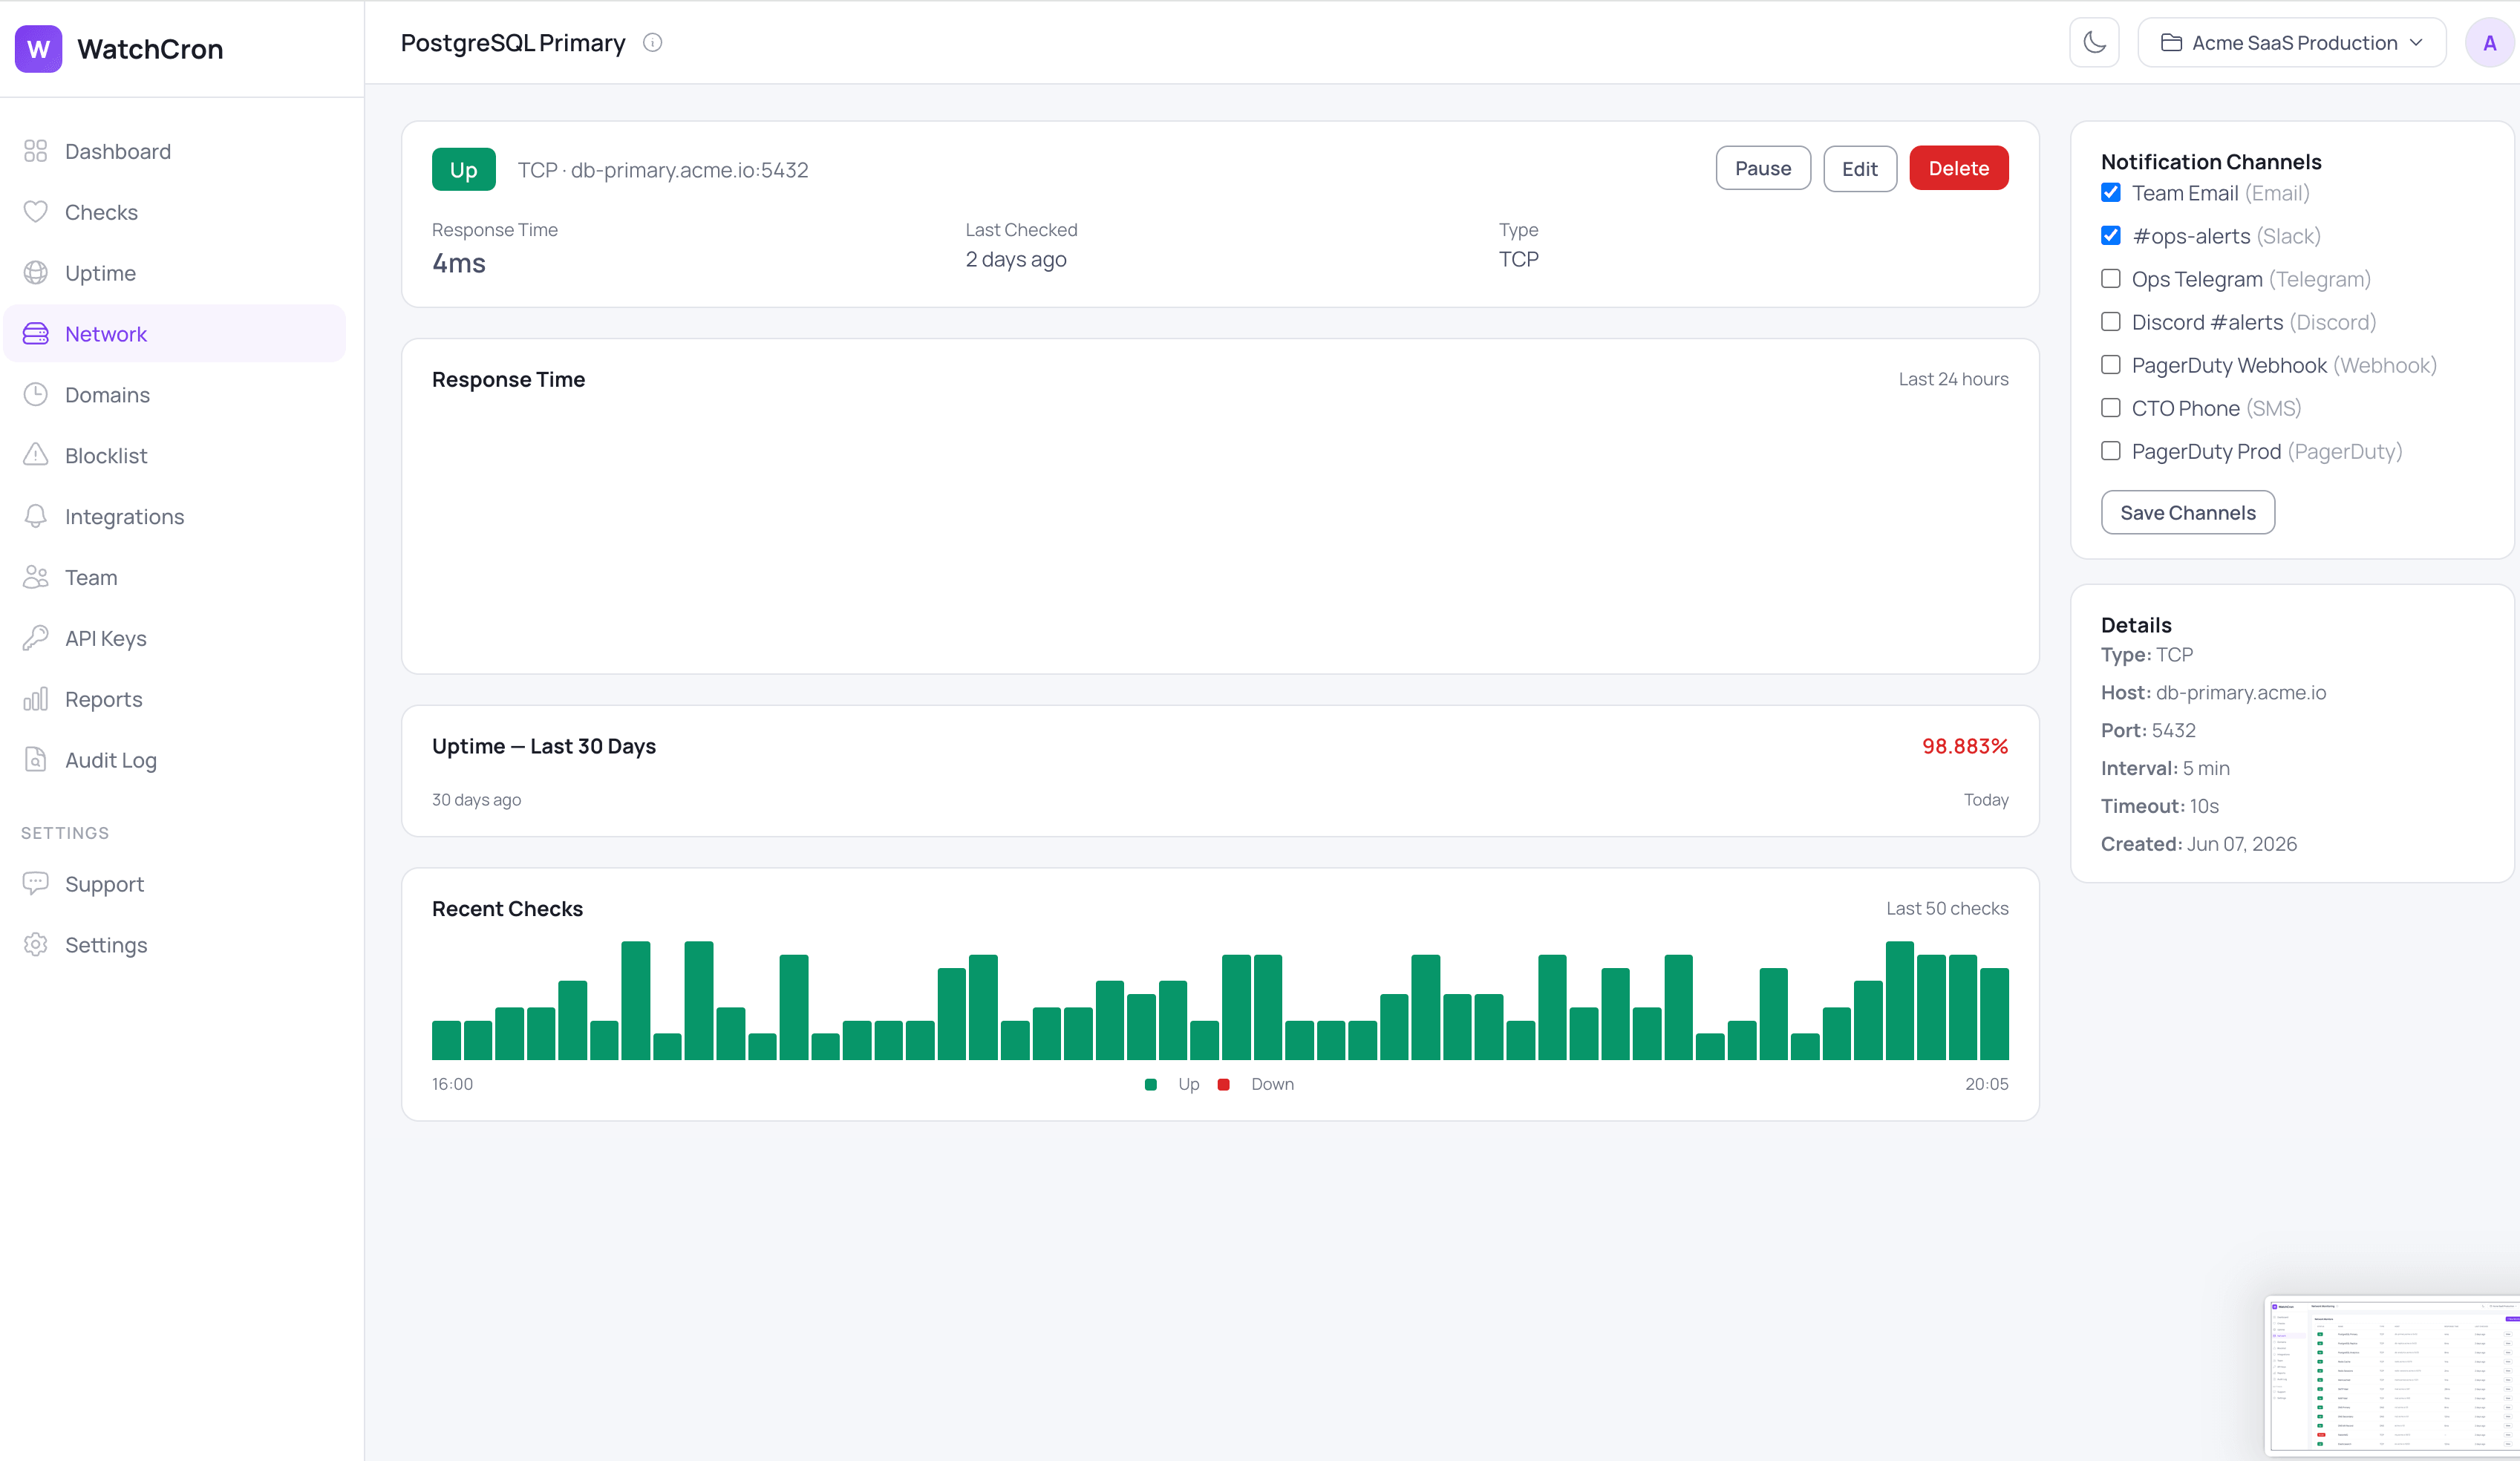
Every protocol records a response time in milliseconds on each check. On a monitor's detail view that becomes a 24-hour response-time chart, a 30-day uptime history, and the last fifty checks shown as bars, alongside a panel with the monitor's type, host, port, interval, and timeout.
What teams check with port monitoring
The services that take a site down when they fail are rarely the website itself:
Databases on their native ports, like PostgreSQL on
5432, MySQL on3306, or MongoDB on27017.Caches and queues that the app leans on, such as Redis on
6379, Memcached on11211, or a RabbitMQ broker.If mail has to keep flowing, an SMTP server on
587or465and an IMAP server on993are worth a TCP check each.SSH on
22, so you know a box is reachable before you need to get into it.DNS resolvers and your own records, checked against an expected value so a mispointed domain surfaces immediately.
Where alerts go
Network monitors use the same ten alert channels as the rest of WatchCron. Email and webhooks work on every plan, including the free one. Slack, Telegram, Discord, and Microsoft Teams come in on the Starter plan, SMS arrives on Pro, and phone-call, PagerDuty, and OpsGenie alerts are on Business for the infrastructure you can't afford to find out about late. Alerts can be acknowledged from the notification itself, and any monitor can be paused while you do maintenance so it doesn't page the team.
What port monitoring won't do
A connection test is a blunt instrument on purpose, and it's worth knowing where the bluntness shows.
A TCP check confirms the port accepts a connection, not that the service behind it is healthy. A database that accepts connections but rejects every login still reads as up, so pair a TCP check with an application-level check when "reachable" and "working" can diverge.
UDP is unreliable by nature, not by implementation. Because there's no connection to establish, the check mostly confirms the socket opened, and it reports down only when the socket can't be created. Don't lean on a UDP monitor for anything you'd want to be paged about.
ICMP is a single ping with no packet-loss analysis, and plenty of hosts and firewalls drop ping entirely. A blocked ping reads as down even when the service is perfectly fine, so use TCP against a real port where you can.
A few more edges worth naming: checks run from a single location with no multi-region confirmation, and there's no retry before an alert, so the first failed check notifies you, which can get noisy on a flaky network. Response time is tracked but not something you can alert on with a threshold yet. And a DNS check compares the first record returned, so a domain with several A records is judged on the first one.
For services that do speak HTTP, uptime monitoring checks the full response, status code, and certificate rather than just the open port. For scheduled jobs that report in on their own, that's cron job monitoring. If you're mapping out which layer each tool covers, the comparison of cron, server, and APM monitoring lays it out, and setup details are in the docs.
Point WatchCron at a host and port and know the moment a database, cache, or DNS record stops answering. The free plan covers your network monitors with email and webhook alerts at no cost and no credit card; Slack, Telegram, and the rest come in on paid plans.
See plans and limits →Frequently Asked Questions
Uptime monitoring checks the full HTTP response of a website or API, including status code, content, and certificate. Port monitoring checks whether an infrastructure service, like a database or cache, is accepting connections at all. They sit at different layers and pair well: one watches the front door, the other watches the services behind it.
Four: TCP, UDP, DNS, and ICMP (ping). TCP is the most reliable and the one to default to.
Yes. Set an expected value on a DNS monitor, and WatchCron flags it down when the resolved record doesn't match, which catches DNS hijacks, botched migrations, and expired domains.
It confirms the port is accepting connections. It won't catch a database that's up but rejecting logins or returning errors, so pair it with an application-level check when you need that distinction.
UDP is connectionless, so "up" is a weak signal that mostly means the socket opened. ICMP is a single ping that many firewalls block outright. Where you can, monitor a real TCP port instead.
Start monitoring in under 2 minutes
Free plan includes 20 checks. No credit card required.
See Plans & Pricing