Most online cron job services do one thing: call a URL on a schedule. When the call fails, you find out hours later — or not at all. Cloud Cron takes a different approach. It runs your scheduled HTTP requests and watches every execution, so failed runs trigger alerts through the same channels you already use for uptime and heartbeat monitoring.
When we were building this, we had a staging setup that used one service for the scheduled calls and a separate heartbeat monitor to confirm they ran. Two dashboards, two sets of credentials, two bills. It was annoying enough that we built Cloud Cron specifically to stop doing that. If you've been juggling a cron service for execution and a separate tool for monitoring, Cloud Cron handles both in one place.
How This Online Cron Job Service Works
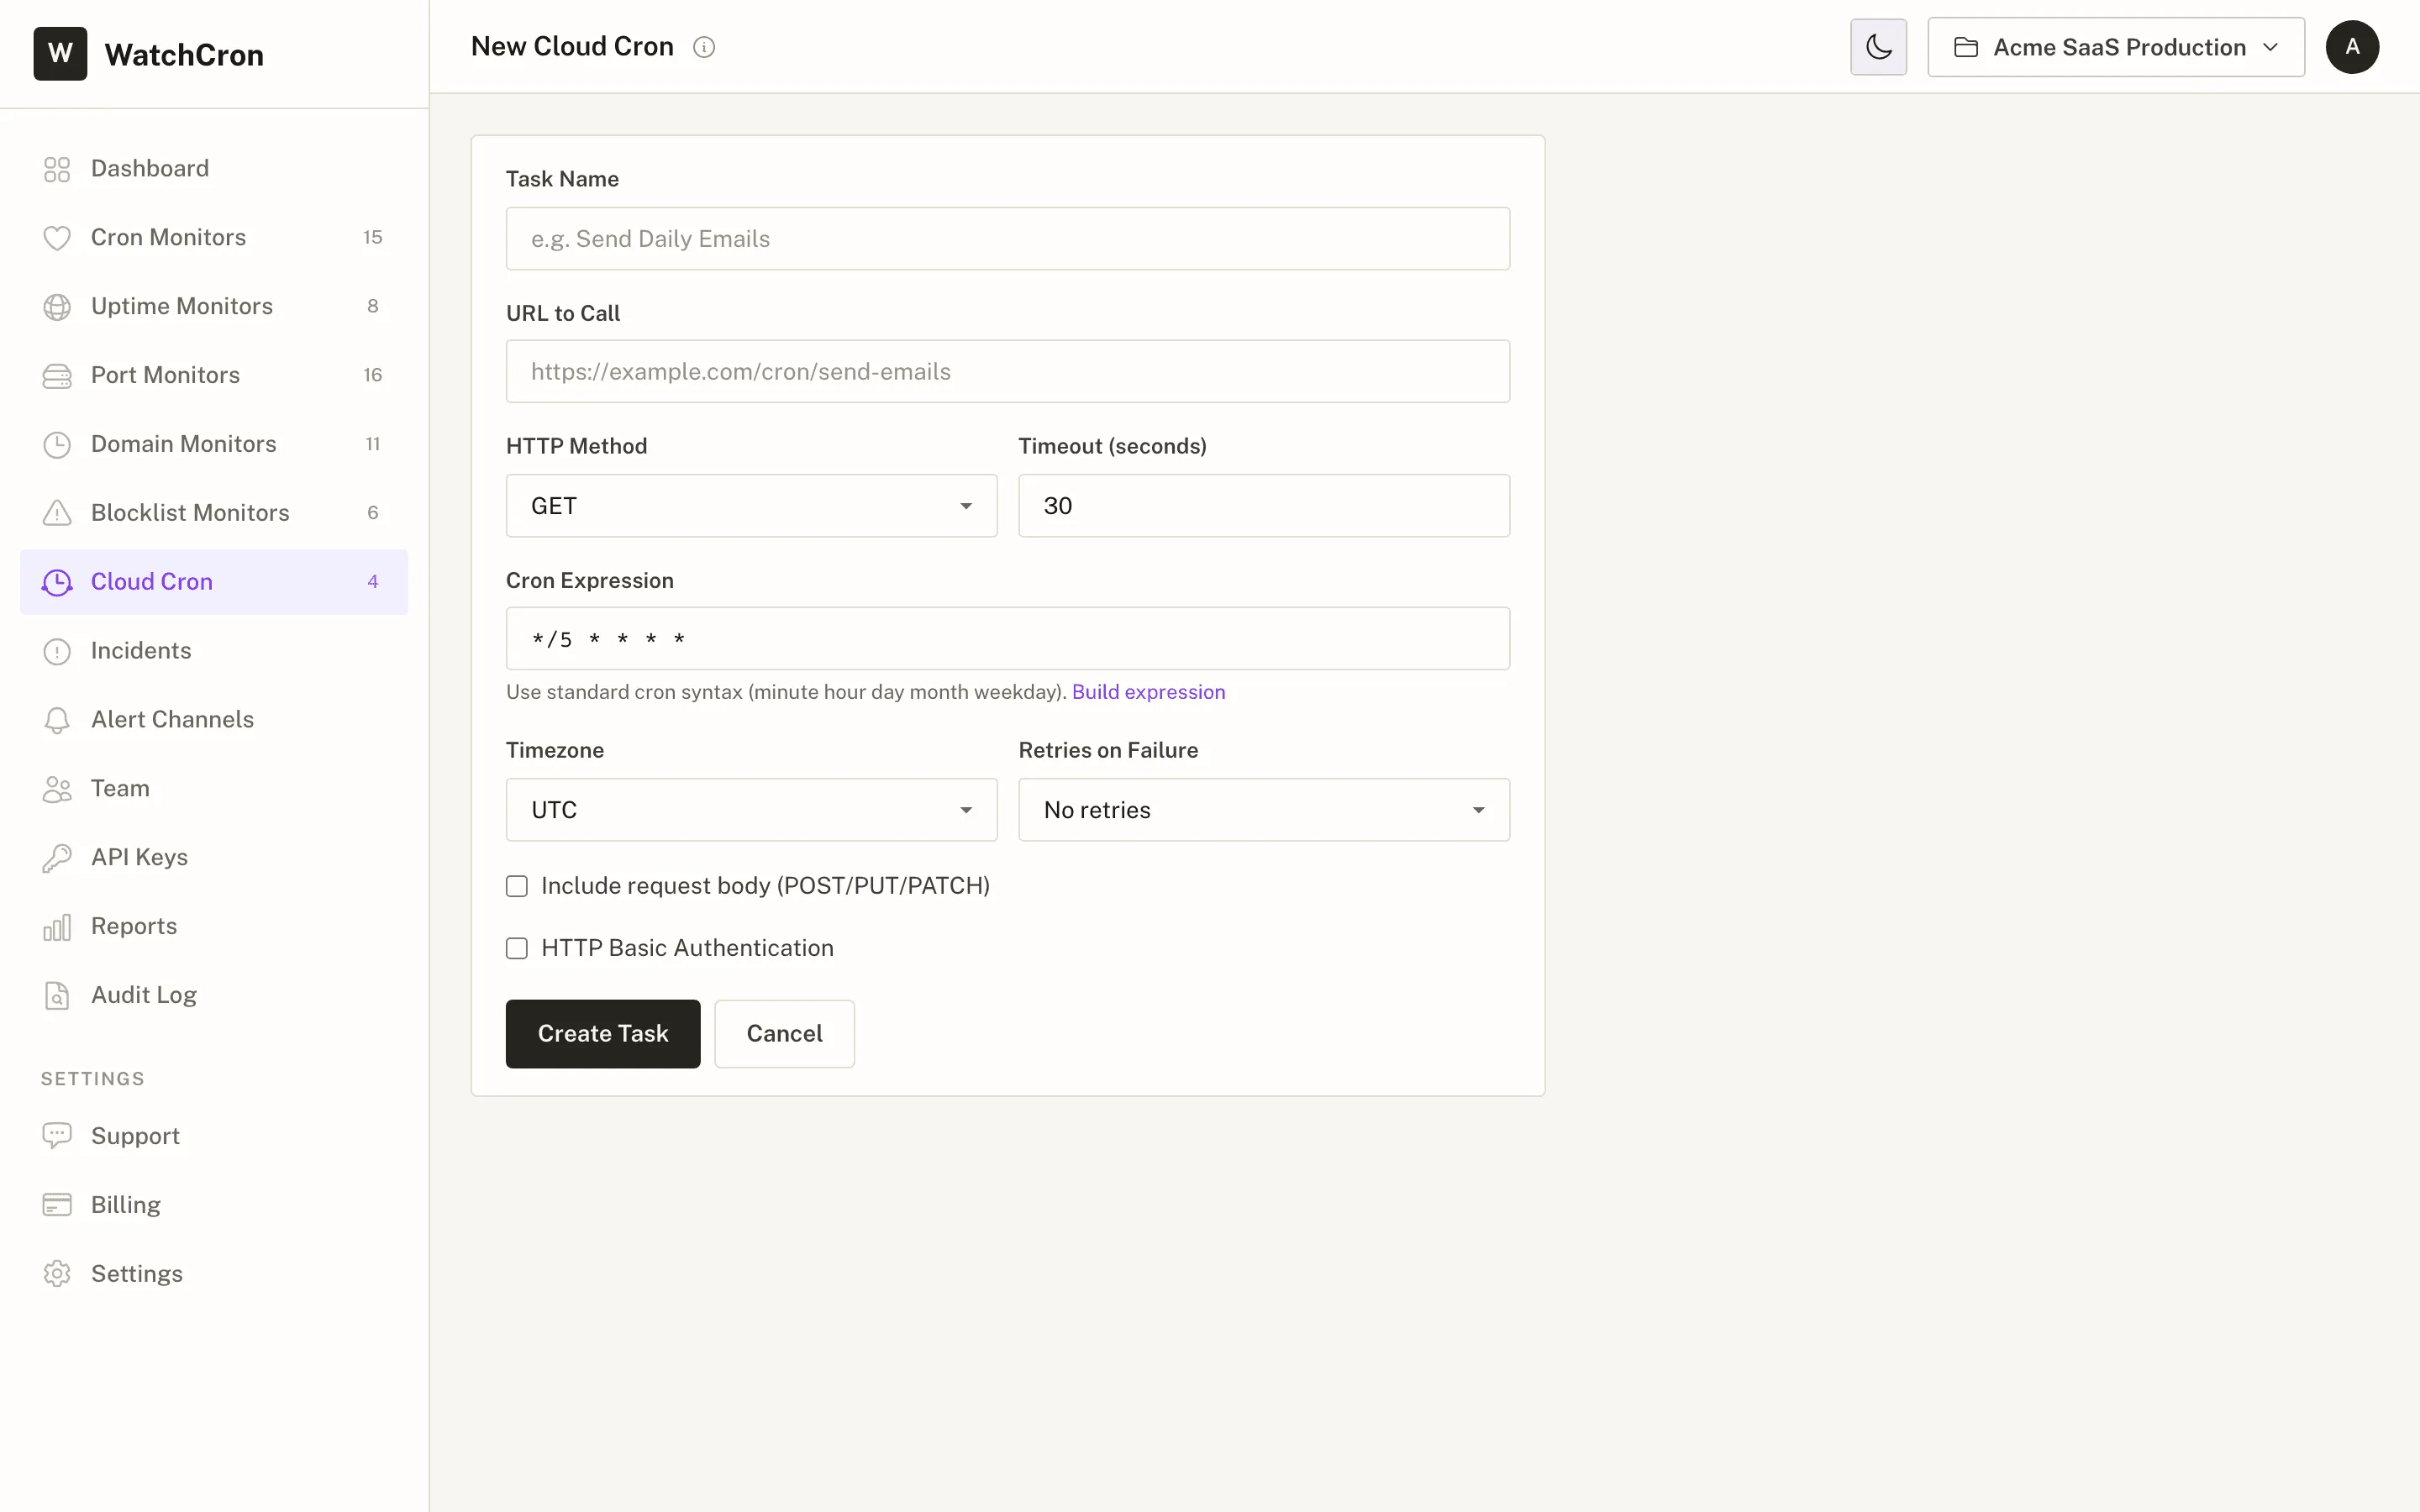
You give us a URL, pick an HTTP method, and set a cron expression. Our servers call that URL on your schedule, from our infrastructure — no crontab, no server to maintain. Every execution gets logged with the status code, response time, and response body.
A typical setup takes about a minute:
- Create a job. Enter a name, the target URL, choose GET, POST, PUT, PATCH, or DELETE, and write a cron expression. The cron expression builder is right inside the form. You can also attach custom headers, a request body for POST/PUT/PATCH, or HTTP Basic Auth credentials.
- Set your timezone and timeout. Cloud Cron respects IANA timezones and handles DST transitions. Timeouts range from 1 to 60 seconds — long enough for most webhook endpoints, short enough to catch hung connections fast.
- Configure retries. If a call fails, we retry up to 5 times with increasing delays between attempts. No more silent failures because a server hiccupped once.
- Pick your alert channels. Slack, email, Telegram, Discord, SMS, PagerDuty, OpsGenie — whatever you already use for monitoring alerts. When a task fails after exhausting retries, you get an alert immediately.
What You Can Schedule
Cloud Cron works as a webhook scheduler for any publicly accessible URL. Some common patterns:
| Use case | How it works |
|---|---|
| Database backups | POST to your backup endpoint every night at 2 AM |
| Cache warming | GET your sitemap URL every 15 minutes to keep caches fresh |
| Report generation | Call your report API on the first Monday of each month |
| Webhook triggers | POST JSON payloads to Zapier, Make, or your own API on a schedule |
| Health checks | Ping your staging server every 5 minutes to keep it awake |
For POST, PUT, and PATCH requests, you can attach a custom request body and headers. HTTP Basic Auth is supported too — useful when your endpoint sits behind authentication. Think of it as a serverless cron alternative that doesn't lock you into AWS or GCP.
Replace WP-Cron With Something Reliable
WordPress ships with wp-cron.php, a pseudo-cron that only fires when someone visits your site. Low-traffic sites might go hours between runs. Some hosting providers disable it entirely. Honestly, wp-cron.php was a rough design choice from the start.
A better pattern: disable wp-cron.php in your wp-config.php and point a Cloud Cron task at https://yoursite.com/wp-cron.php?doing_wp_cron every minute. Scheduled posts publish on time, plugin updates actually run, and cache cleanup stops being theoretical. We go deeper on this in the WordPress monitoring guide.
Built-In Monitoring for Every Scheduled Job
Here's the thing: most cron services will run your job and log whether it returned 200, but they stop there. What they don't track: response time trends, consecutive failure patterns, whether a previously-healthy endpoint started degrading.
We tested three Cloud Cron tasks against a popular alternative for a month. The other service logged pass/fail. Ours caught a backup endpoint that had slowed from 2 seconds to 48 over two weeks — still returning 200, but about to time out.
Every Cloud Cron job gets the same monitoring treatment as your uptime monitors:
- Response time charts — 24-hour graph shows execution duration over time, so you catch slow endpoints before they time out
- Status tracking — each task carries a state: New, OK, Failing, or Paused. State changes create incidents automatically
- Execution log — toggle between chart and table view. Every run shows the status code, duration, and any error message
- The Next 5 Runs preview shows exactly when your job will fire next, timezone and DST accounted for — the same preview that powers our heartbeat monitors
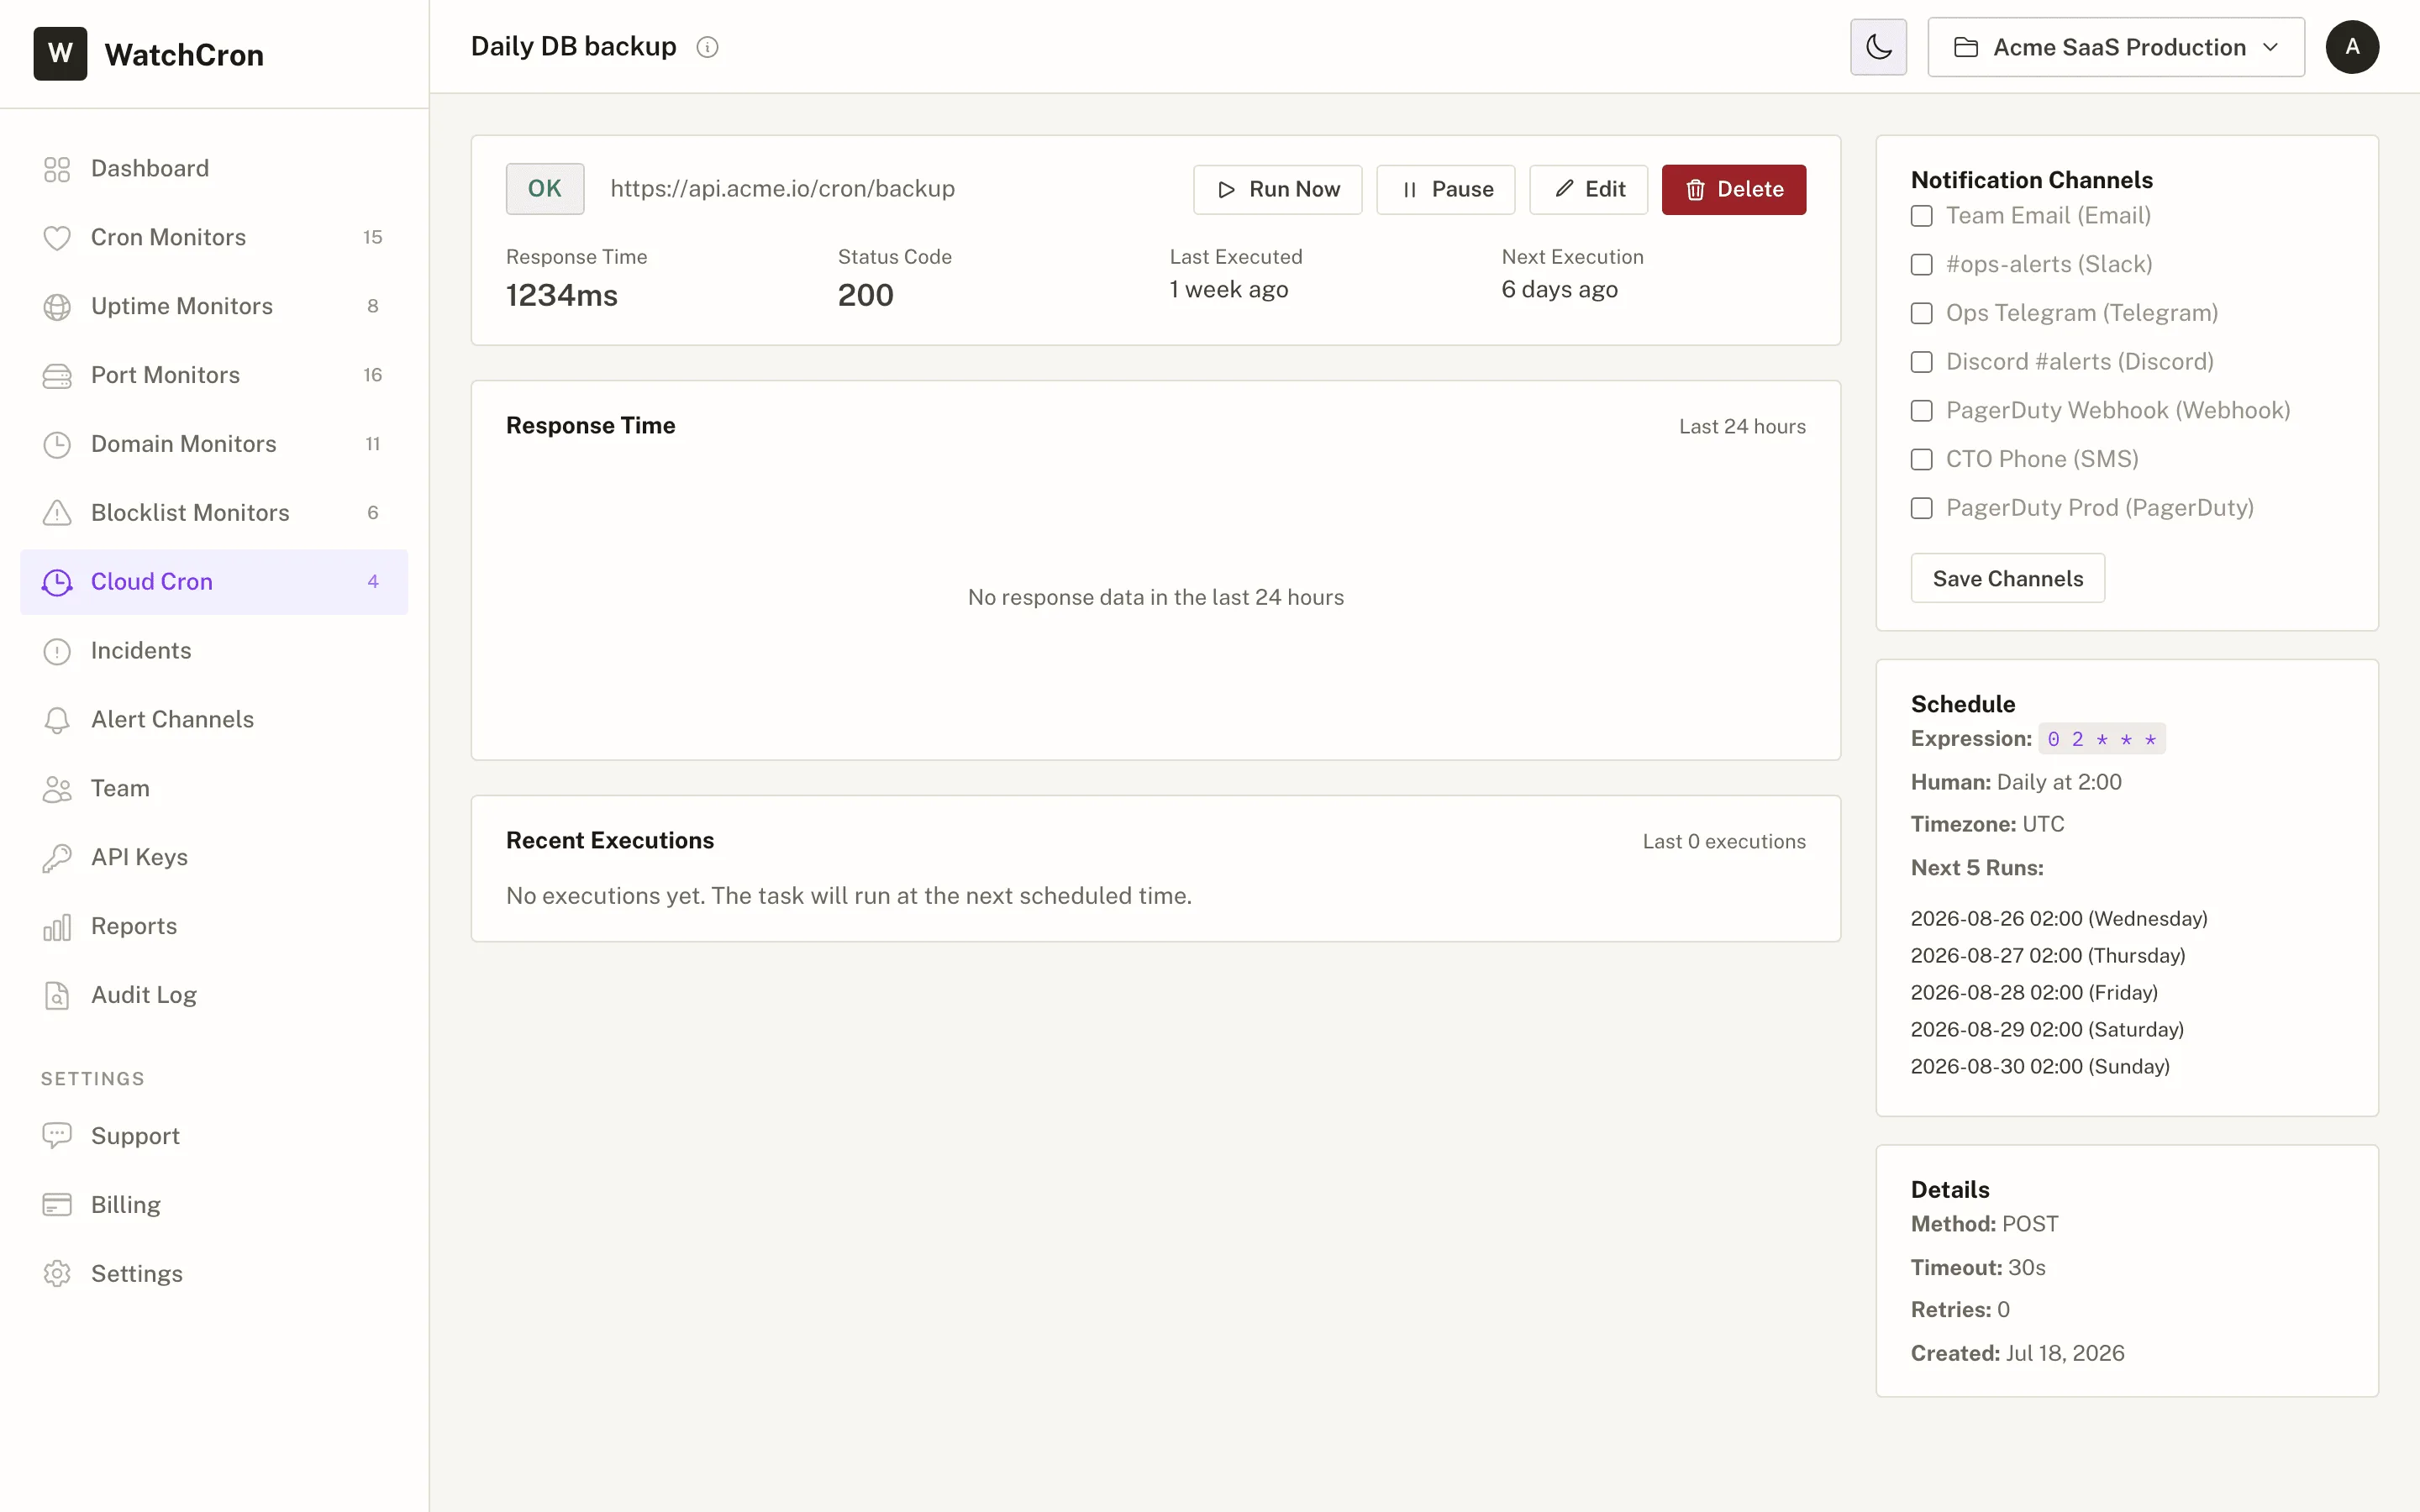
Run Now triggers the job immediately — useful for testing or when you can't wait for the next scheduled run. No waiting. Pause and Resume let you temporarily stop execution without deleting the configuration.
Cloud Cron Pricing
Look, some services charge per execution or use "Executions Per Day" math that requires a spreadsheet. We charge by how many jobs you create.
| Plan | Cloud Cron jobs | Price |
|---|---|---|
| Free | 3 jobs | $0 |
| Starter | 15 jobs | $7/mo |
| Pro | 50 jobs | $19/mo |
| Business | 200 jobs | $49/mo |
Cloud Cron jobs are included in every plan alongside your cron monitors, uptime checks, SSL monitors, and domain expiration alerts. One subscription, one dashboard. Full details on the pricing page.
What Cloud Cron Won't Do
Boundaries exist.
- Long-running jobs. The maximum timeout is 60 seconds. If your task needs minutes to complete, run it on your own server and use heartbeat monitoring to watch it instead.
- Private network endpoints. Cloud Cron calls URLs over the public internet. Internal services behind a firewall won't work unless you expose an endpoint or use a tunnel.
- Job chaining. We don't support "run task B after task A finishes" — yet. For now, each job runs independently on its own schedule.
- Sub-minute scheduling. The minimum interval is one minute. If you need something called every 10 seconds, that's a different kind of infrastructure.
For jobs that don't fit Cloud Cron, our cron job monitoring works with any scheduler — your server's crontab, Kubernetes CronJobs, Laravel's scheduler, GitHub Actions. You run the job however you want, and we watch the heartbeat.
Fits Into Your Existing Monitoring Stack
Your scheduled jobs share the same projects and team permissions as your other monitors. Same dashboard, same permissions. Assign jobs to projects, invite team members with scoped access, and get reports that cover both your scheduled executions and your uptime checks.
Everything is available through the REST API too — create tasks, update schedules, pause and resume programmatically. If you're managing dozens of scheduled jobs across environments, the API saves you from clicking through forms, which gets old fast after the fifth environment.
Your public status pages can pull from Cloud Cron too. When a critical scheduled job starts failing, the status page reflects it automatically — which beats finding out via a support ticket.
Set up your first Cloud Cron job in under a minute. No other online cron job service gives you built-in monitoring at every plan tier. No credit card, no server required.