Incident Management
Detect outages, post real-time status updates, and notify subscribers, all from one dashboard. Free on every plan.
Incident management: tell your customers what happened
Incident management is the process of detecting, communicating, and resolving service disruptions. In WatchCron, that means opening an incident record, posting real-time status updates to your public status page, and sending downtime notifications to subscribers until the issue is resolved.
Catching a failure and telling people about it are two different jobs. Your monitors can flag a service disruption within a minute, but if customers hit an error page before you’ve said anything publicly, the silence costs more trust than the outage itself. Incident management \u2014 your outage communication workflow \u2014 closes that gap: you open an incident, write what you know, post updates as things change, and close it when the service is back. Your public status page delivers those updates to everyone watching.
In WatchCron, incident management is built into every project, on every plan, including the free one. No separate tool to configure or . You create and update incidents in the same dashboard where your monitors live, and everything you write shows up on your public status page within seconds.
How incident management works in practice
Say you manage infrastructure for a client. Every night at 3:00 AM a database backup runs, and you track it with a heartbeat check in WatchCron. One day someone rotates the database server password, the backup script can’t connect, and it exits silently. The monitor notices the expected ping never arrived and a minute later an alert lands in your Slack: “Nightly DB backup: missed.”
You investigate, find the cause (a changed credential) and fix the config. But your client, checking the status page that morning, wants to understand: what happened overnight? Was it serious? Is it fixed?
This is where you open an incident in WatchCron. Go to Incidents, click “+ New Incident” and write:
Title: “Nightly database backup missed”
Status: Identified
Message: “Backup script failed to connect after a credential change. Credentials updated, backup re-run manually and completed successfully.”
The client visits the status page and sees it: there was an incident, the cause is clear, it’s already fixed. The question is answered before they wrote to support. And email subscribers got notified automatically.
Opening an incident: title, status, first message
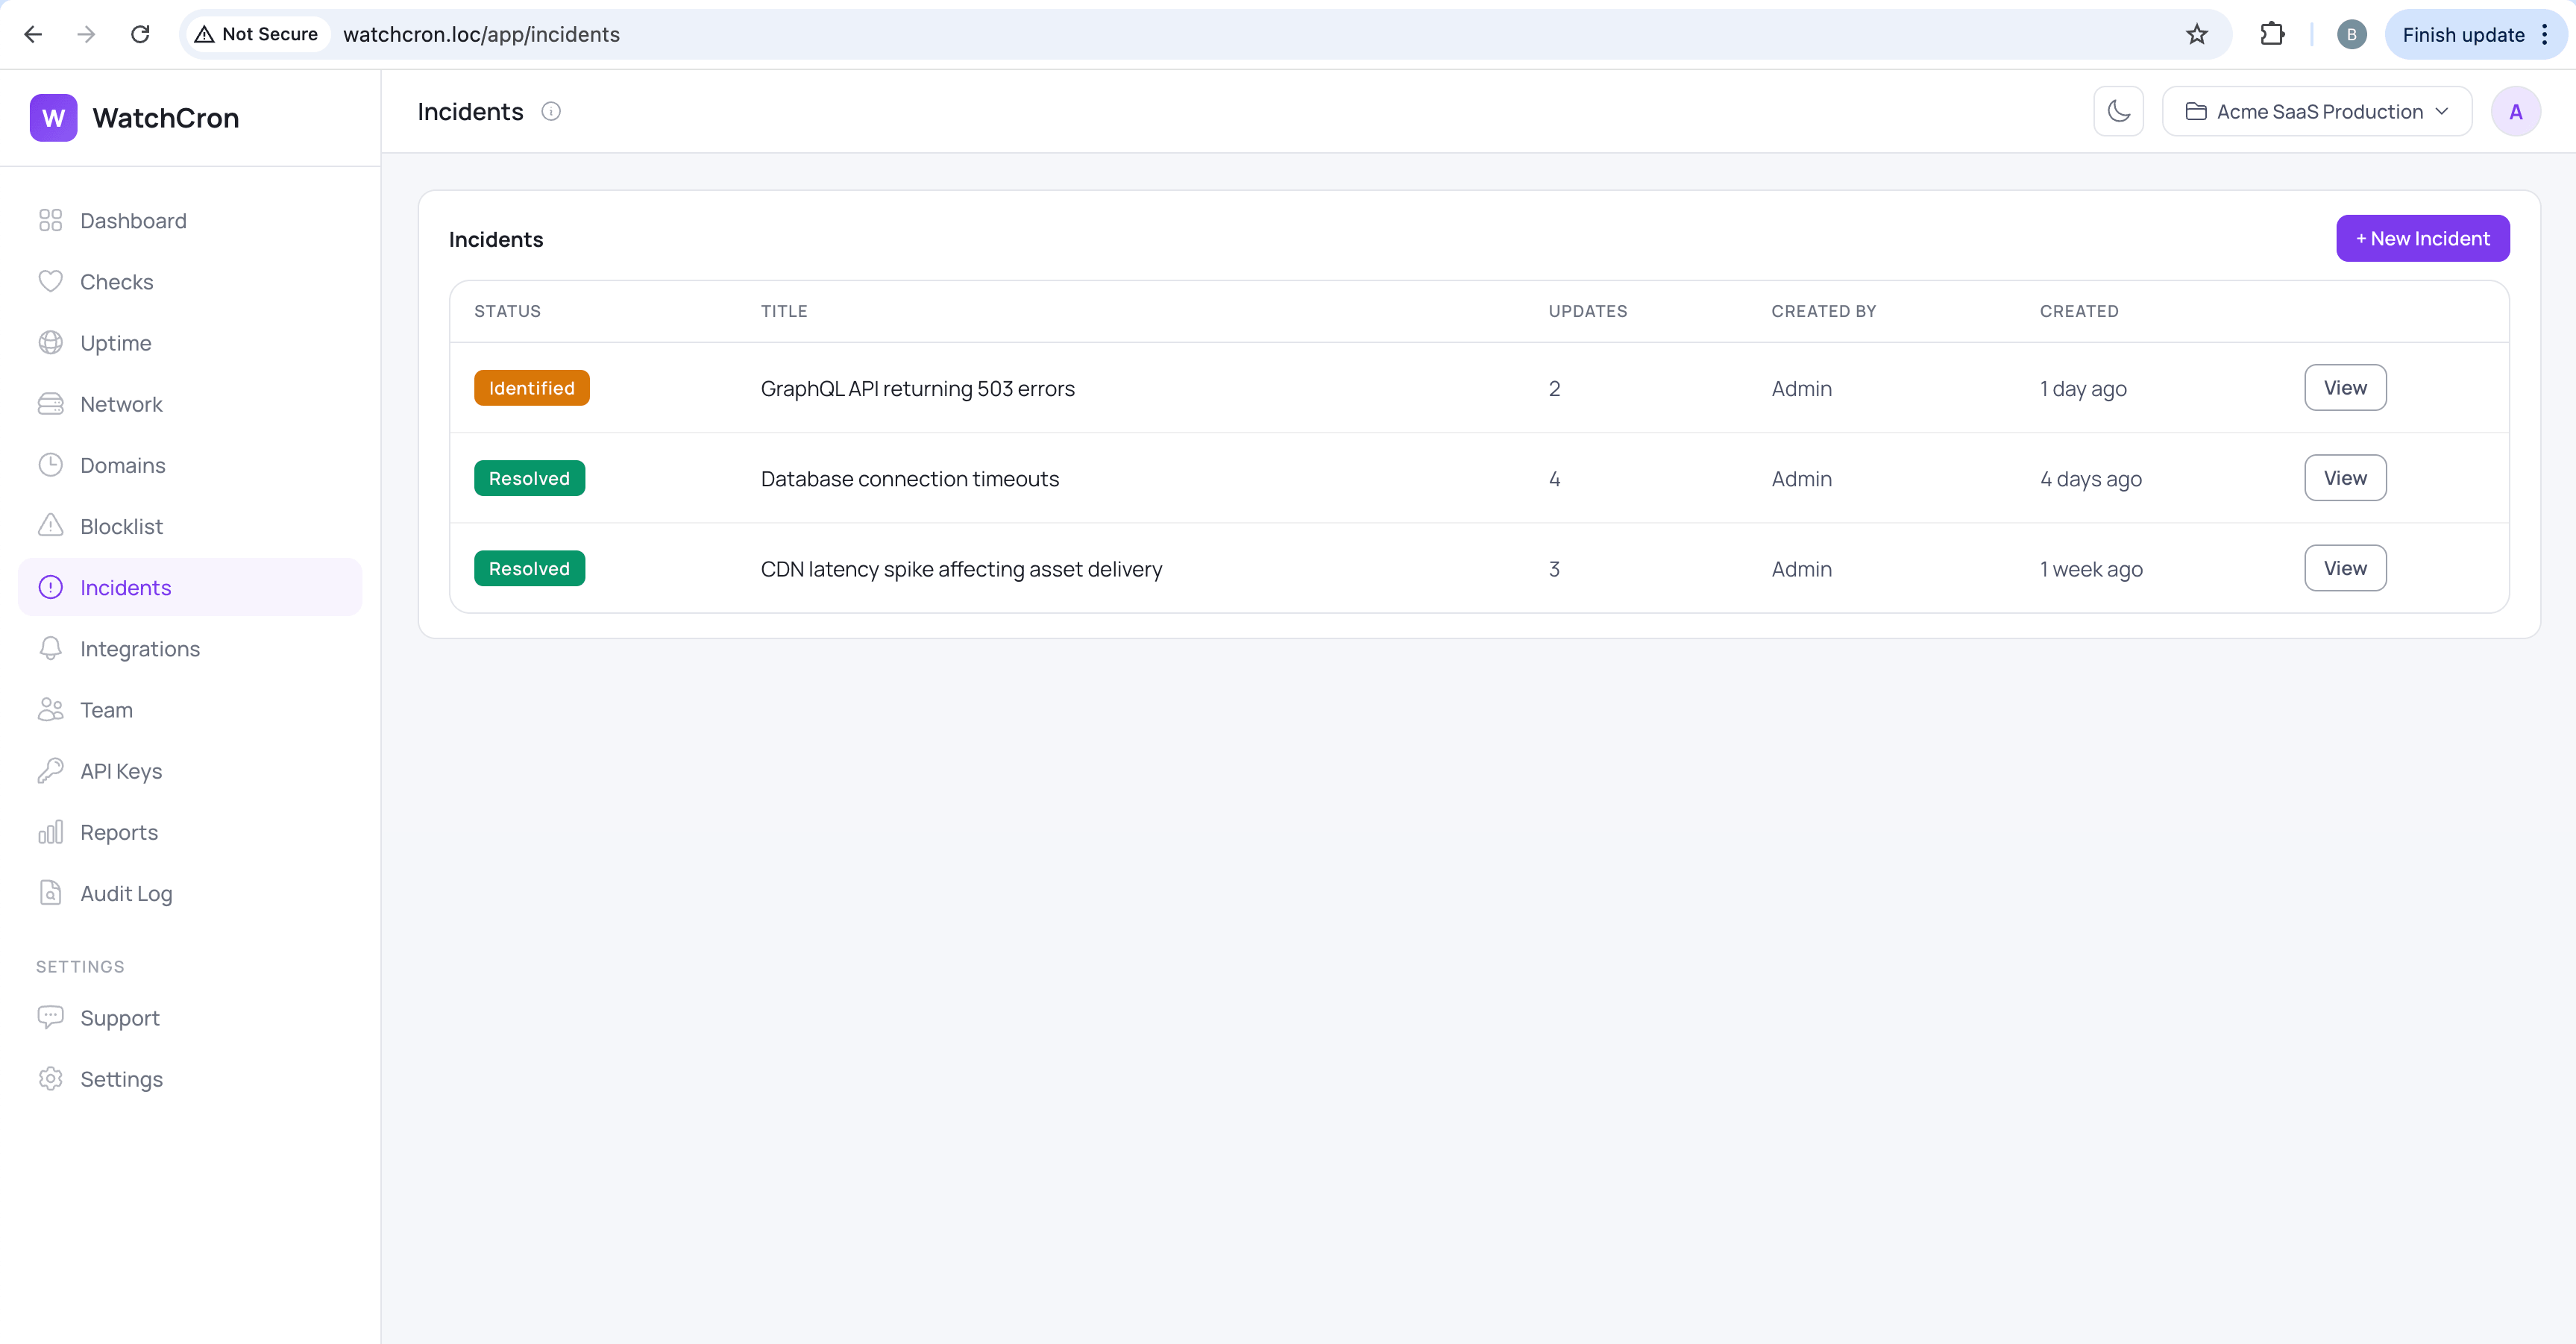
You create an incident from the Incidents screen inside your project. Three fields: a title that names the problem (“GraphQL API returning 503s”, not “Issue”), an initial status, and a first message explaining what you know so far. The title is what subscribers see in the email subject line and what visitors scan on the status page, so specificity matters more than polish.
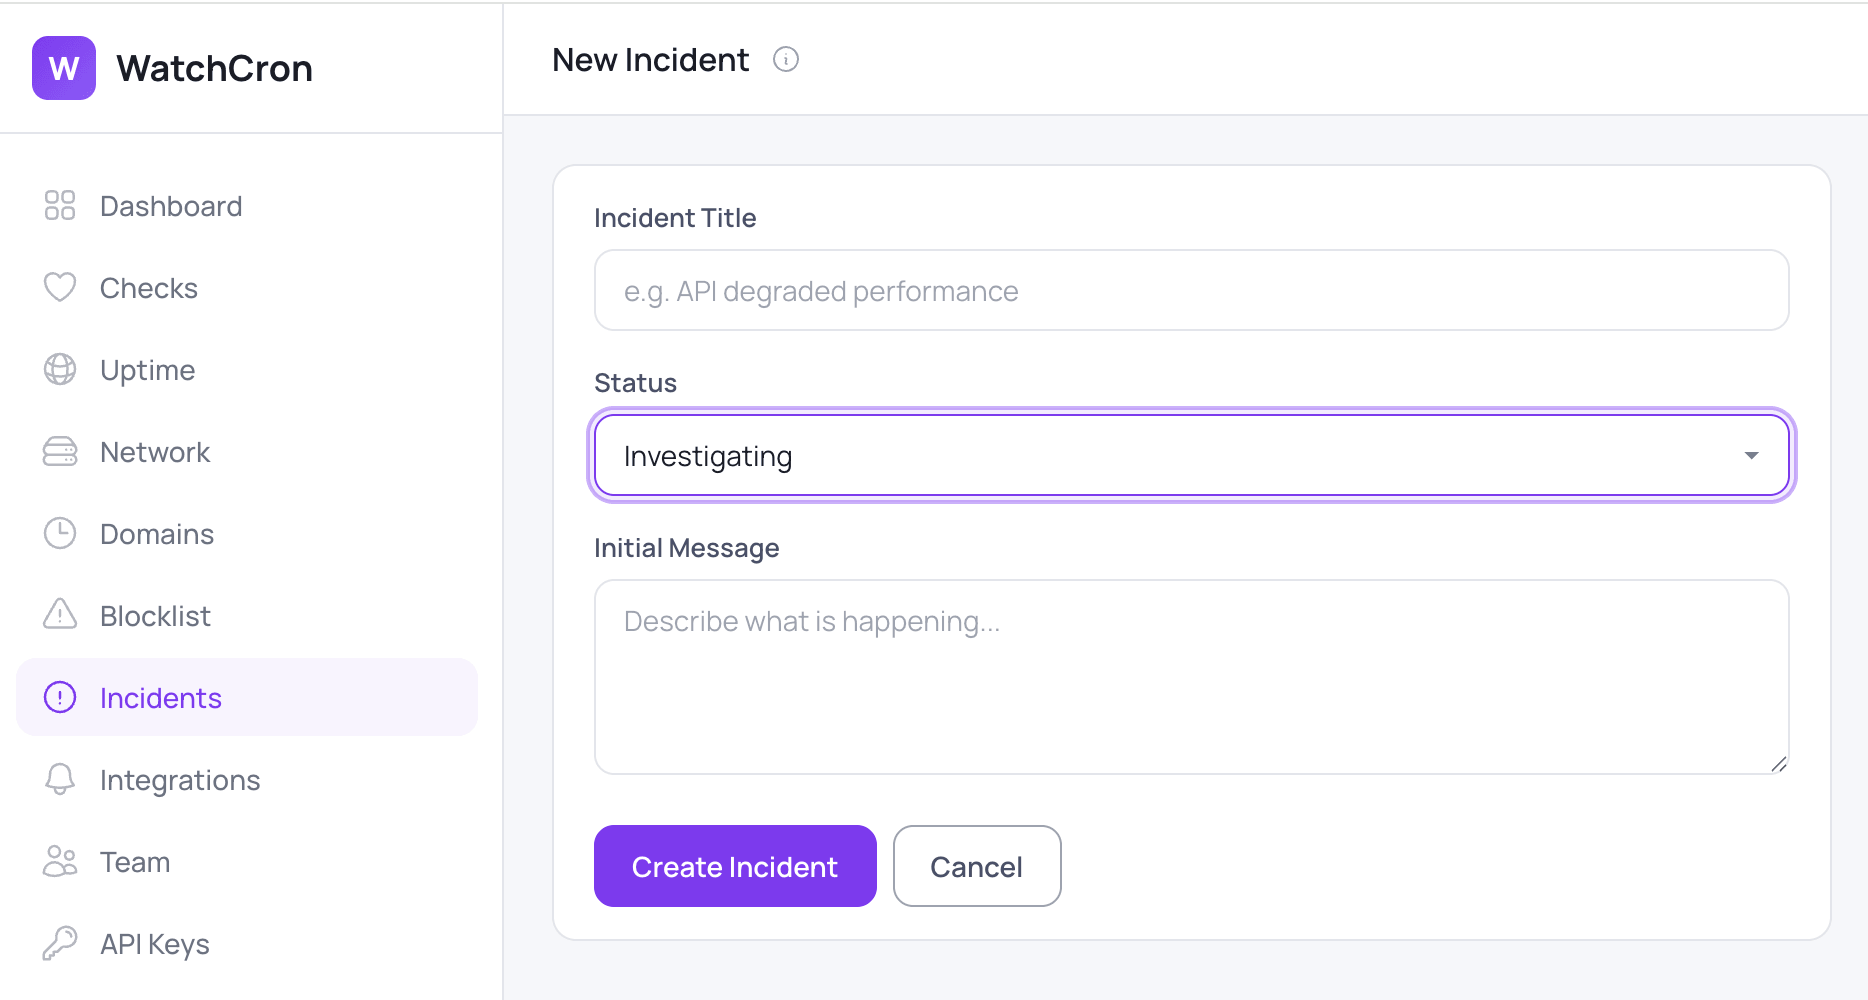
Three starting statuses to choose from: Investigating — when you know something is wrong but haven’t found the cause yet, Identified — when you’ve pinpointed the root cause, and Monitoring — when you’ve applied a fix and are watching whether it holds. You can’t open an incident as Resolved — an incident nobody worked on is just noise in the timeline and trains subscribers to ignore your updates.
Four incident statuses and when to use each
Every incident moves through a simple progression. You don’t have to hit all four. Jumping from Investigating straight to Resolved after a quick restart is perfectly fine, but the set covers the pattern most outages follow.
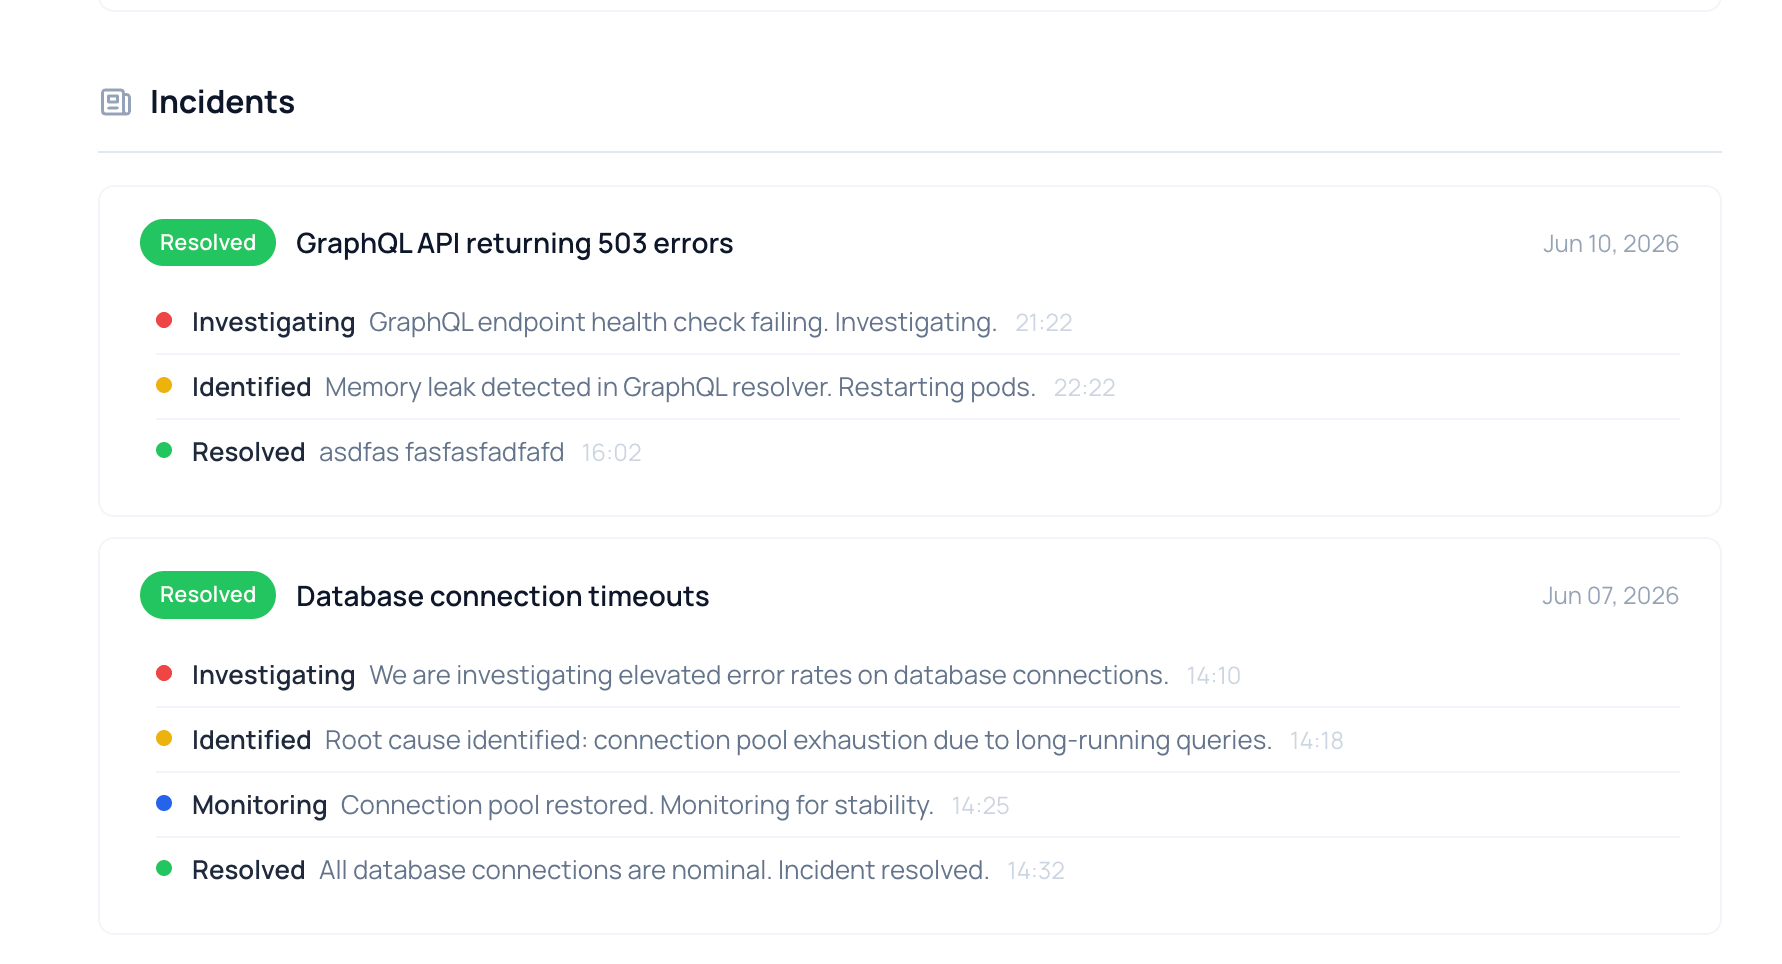
Investigating (red) — the starting point: alerts fired, you’re digging through logs. The public message can be short: “We’re seeing elevated error rates on the payments API and are looking into it.” That one line is enough for a customer to understand: they know, they’re on it, no need to open a ticket.
Identified (orange) — root cause found. “Memory leak in the GraphQL resolver. Restarting pods.” Switching to Identified tells subscribers that diagnosis is done and a fix is on the way.
Monitoring (blue) — fix applied, you’re watching metrics. “Pods restarted, error rates back to baseline. Watching for the next 15 minutes.”
Resolved (green) — incident closed, resolution time recorded \u2014 your mean time to resolution (MTTR) captured automatically. Subscribers get a final email, the incident moves from the active section of the status page to the history, where it stays visible for seven days.
Incident updates build the timeline
Each update adds an entry to the incident timeline \u2014 a real-time log of the entire incident lifecycle: message, status, timestamp, and who posted it. The timeline . You can’t edit or delete previous entries. Because a corrected history is worse than a messy one. If you said something wrong, post a correction as a new update.
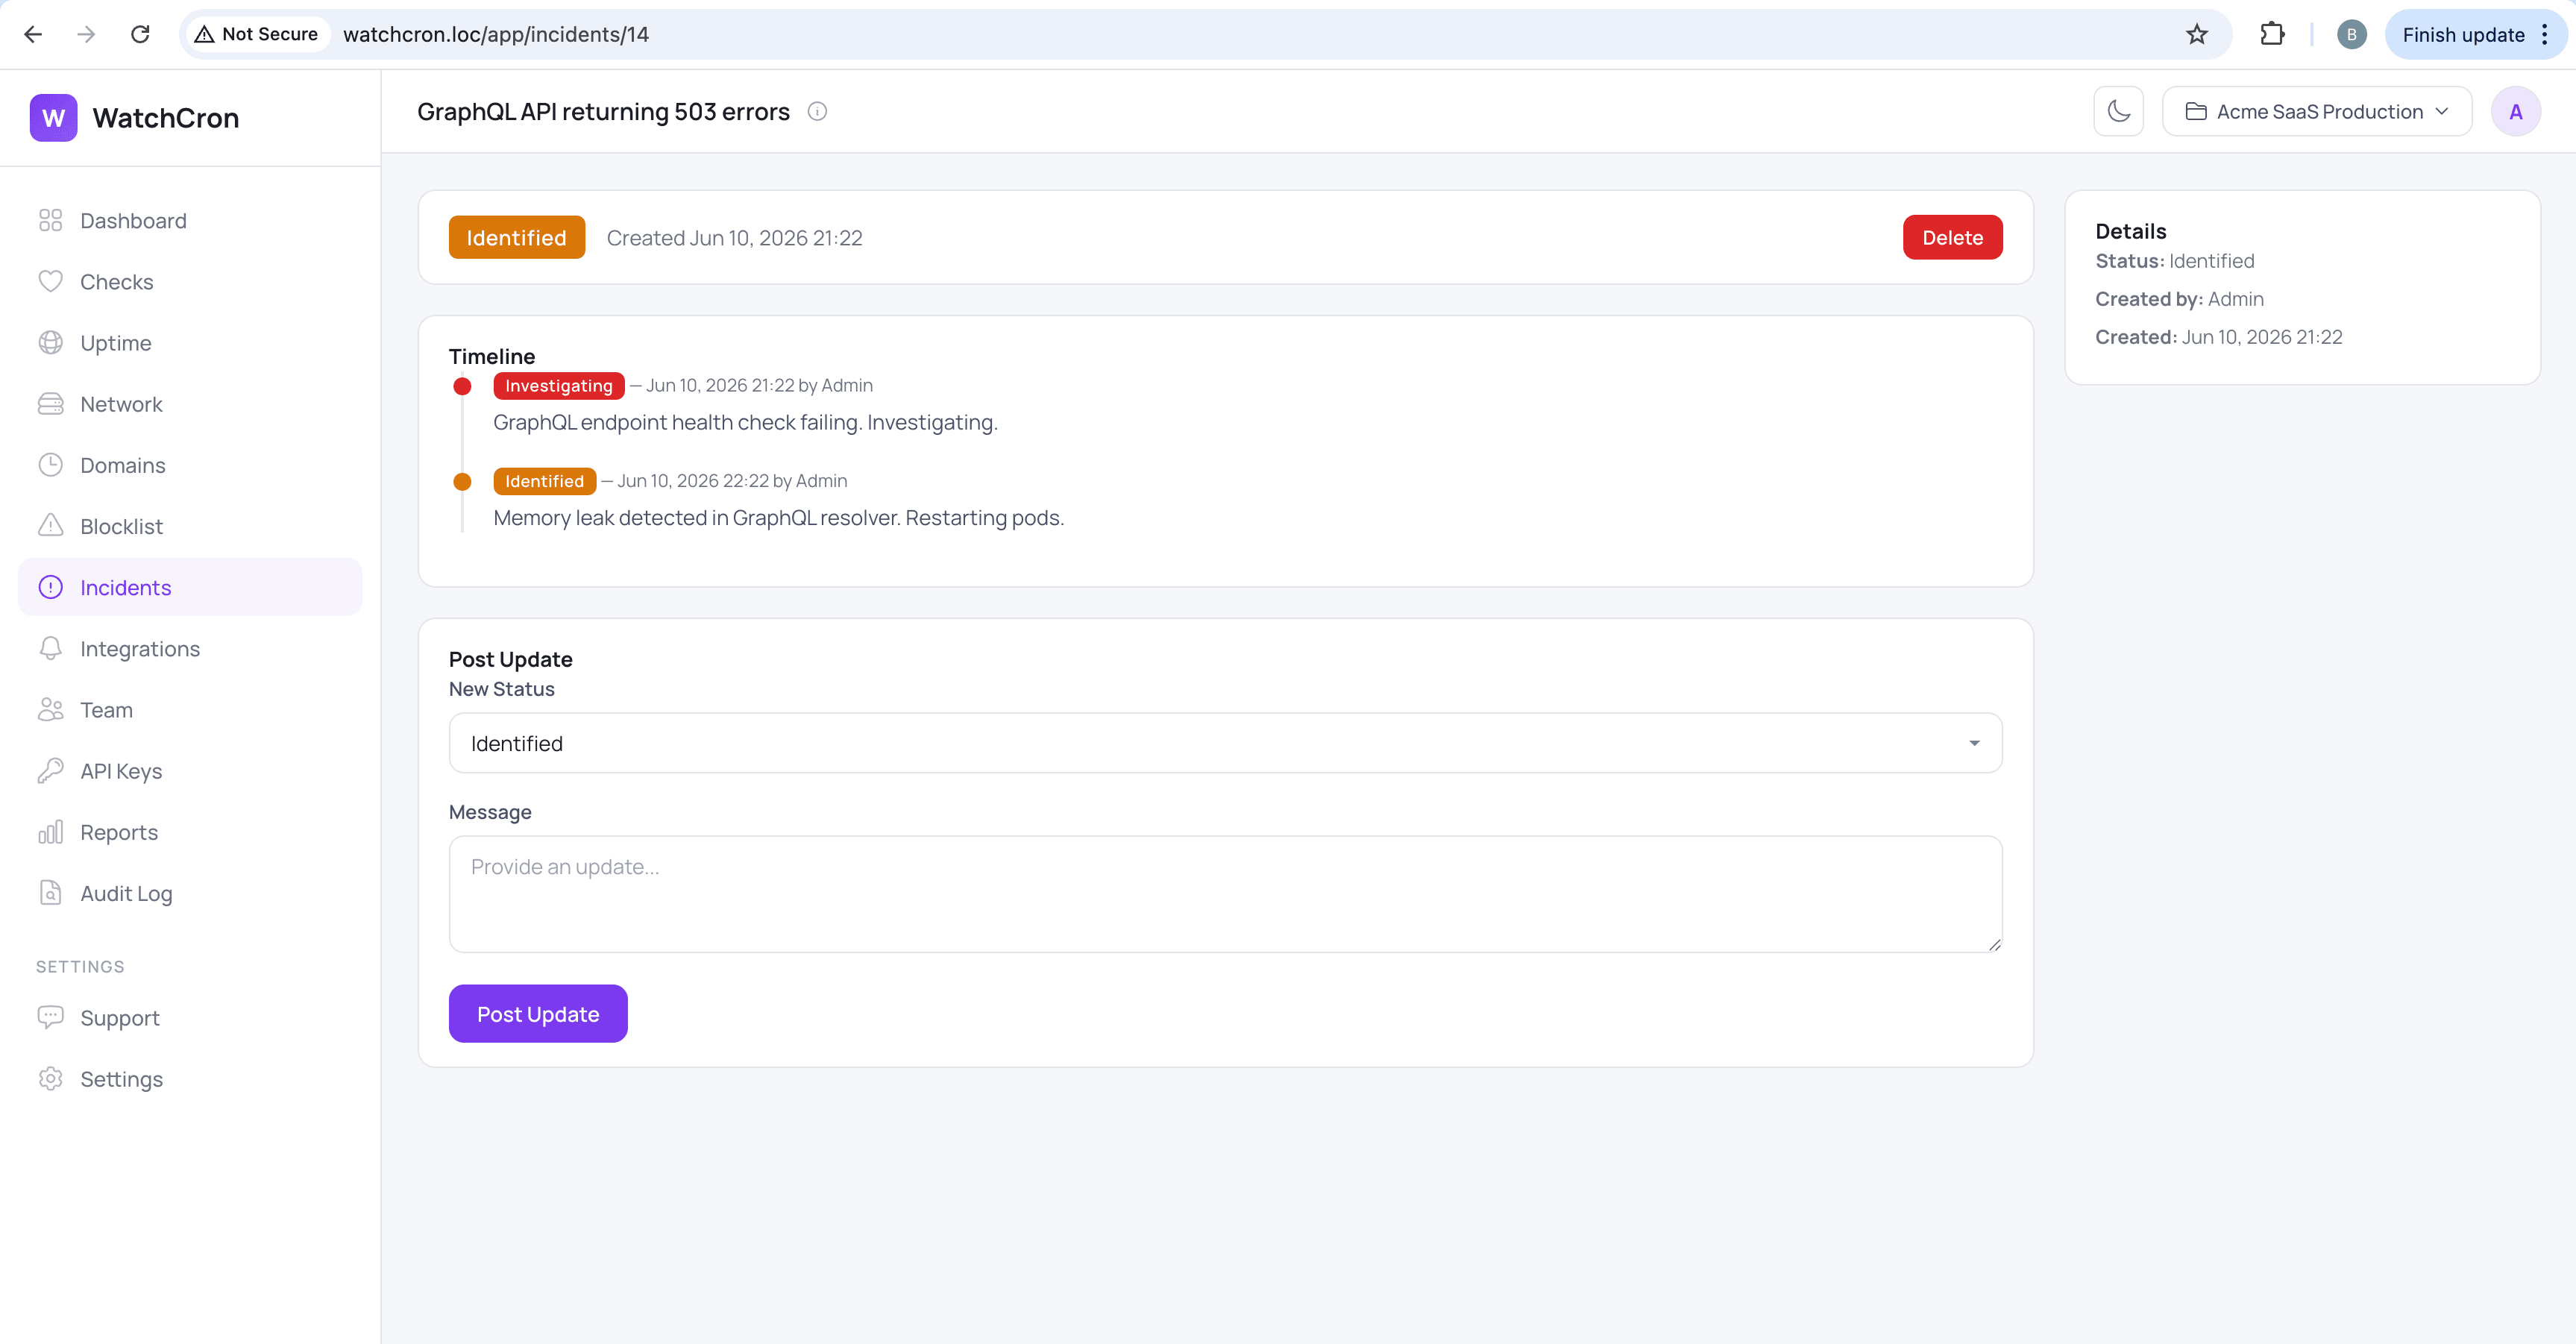
Customers watching the status page see a chronological narrative: what broke, when the cause was found, what was done, and when the fix was confirmed. Teams running a post-incident review get the same record without having to reconstruct it from Slack threads.
Every update, whether the first or the tenth, sends an email to your status page subscribers. Automated monitor events (brief blips from cron checks and uptime monitors) remain visible in the status page history but don’t trigger emails. That distinction keeps the mailing useful instead of teaching people to mute you.
Where incidents meet the status page
Incidents are what your team writes during a problem. The status page is the public, read-only display of that work.
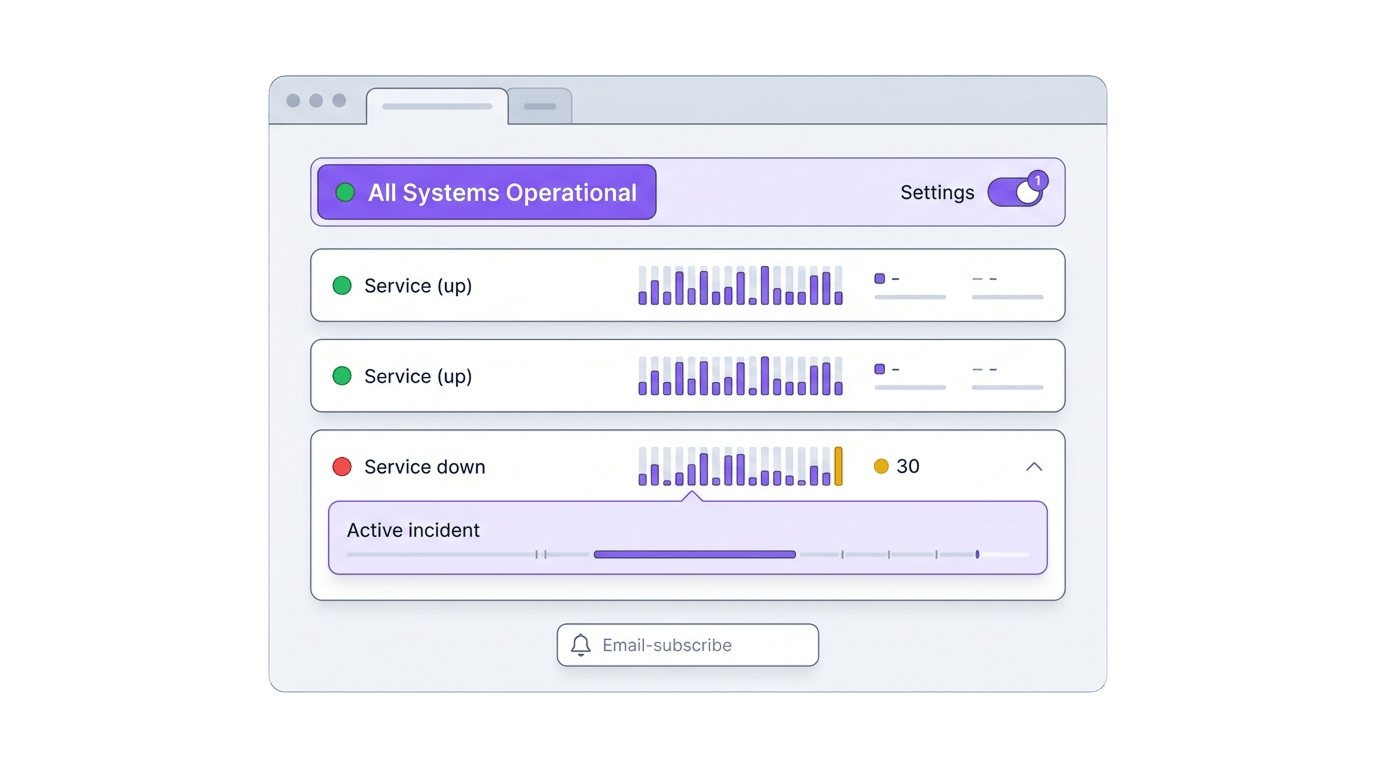
Active incidents appear at the top of the status page with the full update timeline. After resolution they stay in a “recently resolved” section for , long enough for someone who missed the outage to see what happened. Below that, the page shows automatically logged events from the last 90 days, so the history never looks empty even for services without a single hand-written incident.
The status page banner switches from “All Systems Operational” to “Partial System Outage” or “Major System Outage” based on monitor states, but it’s the incident updates that give that banner context. A red banner with an incident reading “Database failover in progress, read replicas healthy, writes back within minutes” is an entirely different experience than a red banner with no explanation.
Incident notifications: who gets alerted and when
Two separate streams run here, and it’s worth keeping them apart:
Monitor alerts go to your team. That’s Slack, Telegram, SMS, email (the channels you configured for your uptime checks, cron monitors, port monitors, SSL monitors, and domain expiry checks. The goal is for your engineer to learn about the problem and start investigating.
Incident notifications go to status page subscribers. These are your customers who subscribed through the public page. They receive an email when you create an incident, post an update, or close it.
The internal alert and the public incident are separate actions for different audiences. A monitor alerts the team automatically. An incident for customers is something you create when you decide the situation deserves a public explanation.
No maintenance windows, and why
We deliberately chose not to build a separate maintenance window feature. The reasoning: scheduled maintenance is essentially the same thing as an incident, except you know about it in advance. A separate record type for this would add complexity to the interface without giving subscribers . What they need to know is that a service will be unavailable, why, and when it’ll be back. An incident with a clear title like “Scheduled maintenance: database migration, ~20 min downtime” does exactly that.
The trade-off we landed on: planned work looks the same as a real outage in the history. We decided that’s acceptable because the title itself distinguishes one from the other clearly enough. If your SLA reporting requires a strict separation between incidents , a tool with dedicated maintenance tracking will serve you better. But for most teams we’ve talked to, the difference wasn’t worth a separate feature.
What this doesn’t replace
The goal is one specific thing: telling your customers what happened, what’s being done, and when it’ll be fixed. We didn’t try to turn it into a full war-room tool with runbooks, on-call rotations, and post-mortem templates. That job belongs to PagerDuty, OpsGenie, and . They coordinate who on the team responds and how. We’re not trying to replace them.
In practice they work well together. Your alert channels (Slack, Telegram, SMS) notify the team when something goes down. That’s the internal story. When someone on the team understands the problem is real and customers should know about it, they open an incident in WatchCron. The internal alert and the public update are two separate actions, because they’re for different audiences.
One more decision we made: monitors don’t create incidents automatically. We considered it but decided against it. Picture this: a service flickers for 30 seconds and recovers on its own. An automatic incident in that case means an email to subscribers, a moment of panic, and a minute later “oh, everything’s fine.” A few of those, and people stop reading your notifications. So we left that call to you. You know better than anyone what deserves a public explanation and what can be quietly ignored.
Incident management is included on every plan, including the free one. Open your first incident in minutes. No configuration, no separate tool.
Create Free Account →Start with your first incident
Every project on any plan gets incident management, including the free one. Go to Incidents in the dashboard sidebar, create a test incident, and see how it looks on your status page. If you haven’t enabled a status page yet, it’s one toggle in project settings. Check what’s included in each plan on the pricing page, or create an account and post your first incident.
Frequently Asked Questions
Yes, on every plan. Creating incidents, posting updates, and email notifications to subscribers all work regardless of your plan.
No. Monitor alerts notify your team through configured channels, but incidents are created manually. You decide what warrants public communication.
You can\u2019t \u2014 the timeline is append-only. If you need to correct something, post a new update. You can delete an entire incident, but individual updates stay as posted.
Email subscribers of your public status page \u2014 meaning your customers. Your team\u2019s alerts (Slack, SMS, etc.) are a separate stream tied to monitors.
Not a dedicated one. Open an incident with a descriptive title before planned work and close it when you\u2019re done. Subscribers get the same notification flow.
Create an incident in WatchCron with a title and description. It instantly appears on your public status page, and all email subscribers receive a notification. Each time you post an update, subscribers get another email with the latest status.
Four statuses: Investigating (looking into the issue), Identified (root cause found), Monitoring (fix applied, watching metrics), and Resolved (incident closed). You can skip stages \u2014 jumping straight from Investigating to Resolved after a quick fix is normal.
Start monitoring in under 2 minutes
Free plan includes 20 checks. No credit card required.
See Plans & Pricing